Zooming out and seeing the big picture is the first step to understanding the digital customer journey end-to-end. Digital analytics provides the necessary framework to generate the data needed for this big-picture perspective.
When used correctly, it allows you to see the nuances of the customer experience and refine all aspects of your sales and marketing strategy.
What Is Digital Analytics?
Digital analytics refers to the sequence of steps involved in the process of extracting, measuring, analyzing, and interpreting data across all digital sources.
With digital analytics, you’re able to gather customer data from practically any digital source, such as:
- Your website
- Social media accounts
- Your content marketing campaign
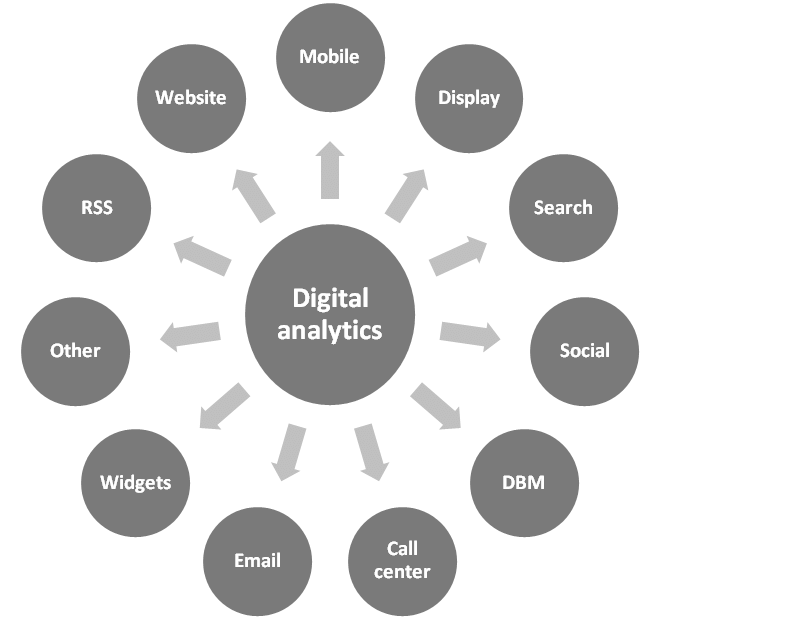 Source: ResearchGate
It then takes the information and breaks it down visually so that it can be easily understood and your findings applied.
Whatever specific metrics you want to measure, digital analytics provides the foundation for generating all of the data you need and sorting it out in a way that’s coherent and easy to understand.
Most modern digital analytics place a heavy emphasis on data visualization. Because of this, marketers are able to gain valuable insights without having to be data scientists.
As a result, digital analytics eliminates much of the “data gatekeeping” that often happened in the past.
Armed with the information gained from digital analytics, you can make data driven decisions that: 1) help you identify pain points that need to be addressed, 2) provide a more rewarding digital experience across the board, and 3) help you reach each core business objective with less friction.
Rather than relying on speculation, digital analytics put you in the driver’s seat so you can be certain of patterns and trends.
In turn, it provides you with valuable business intelligence that can help you approach sales and marketing with the utmost confidence.
Given that nearly 92% of companies that use digital analytics see measurable value, it’s likely that your business can benefit from using a customer data platform as well.
If you’re interested in joining a community where you can learn and network with others, check out the Digital Analytics Association.
Digital Analytics Examples
As we’ve mentioned, digital analytics can be applied to a wide variety of sources.
Now let’s go a bit deeper and look at some specific ways you can use the insights gleaned from digital analytics data to get your sales and marketing teams firing on all cylinders.
Some common website metrics that can be analyzed with digital analytics include:
- Number of new and returning visitors
- Average time spent on site
- Pages per session
- Bounce rate
- Conversion rate
- Traffic sources
Common social media metrics can include:
- Content impressions
- Content reach
- Engagement rate (likes, shares, comments)
- Click-through rate
- Conversion rate
- Follower growth
Content marketing metrics that can be analyzed include:
- Number of pageviews
- Average time spent on page
- Number of shares
- Top-performing keywords
- Traffic volume by blog post category
- Click-through rate
- Conversion rate
As for email, marketers can determine:
- Open rate
- Click-through rate
- Email forward rate
- Subscriber growth
- Unsubscribe rate
Besides analyzing individual segments of sales and marketing, you can zoom out even more and look at the holistic customer journey in its entirety.
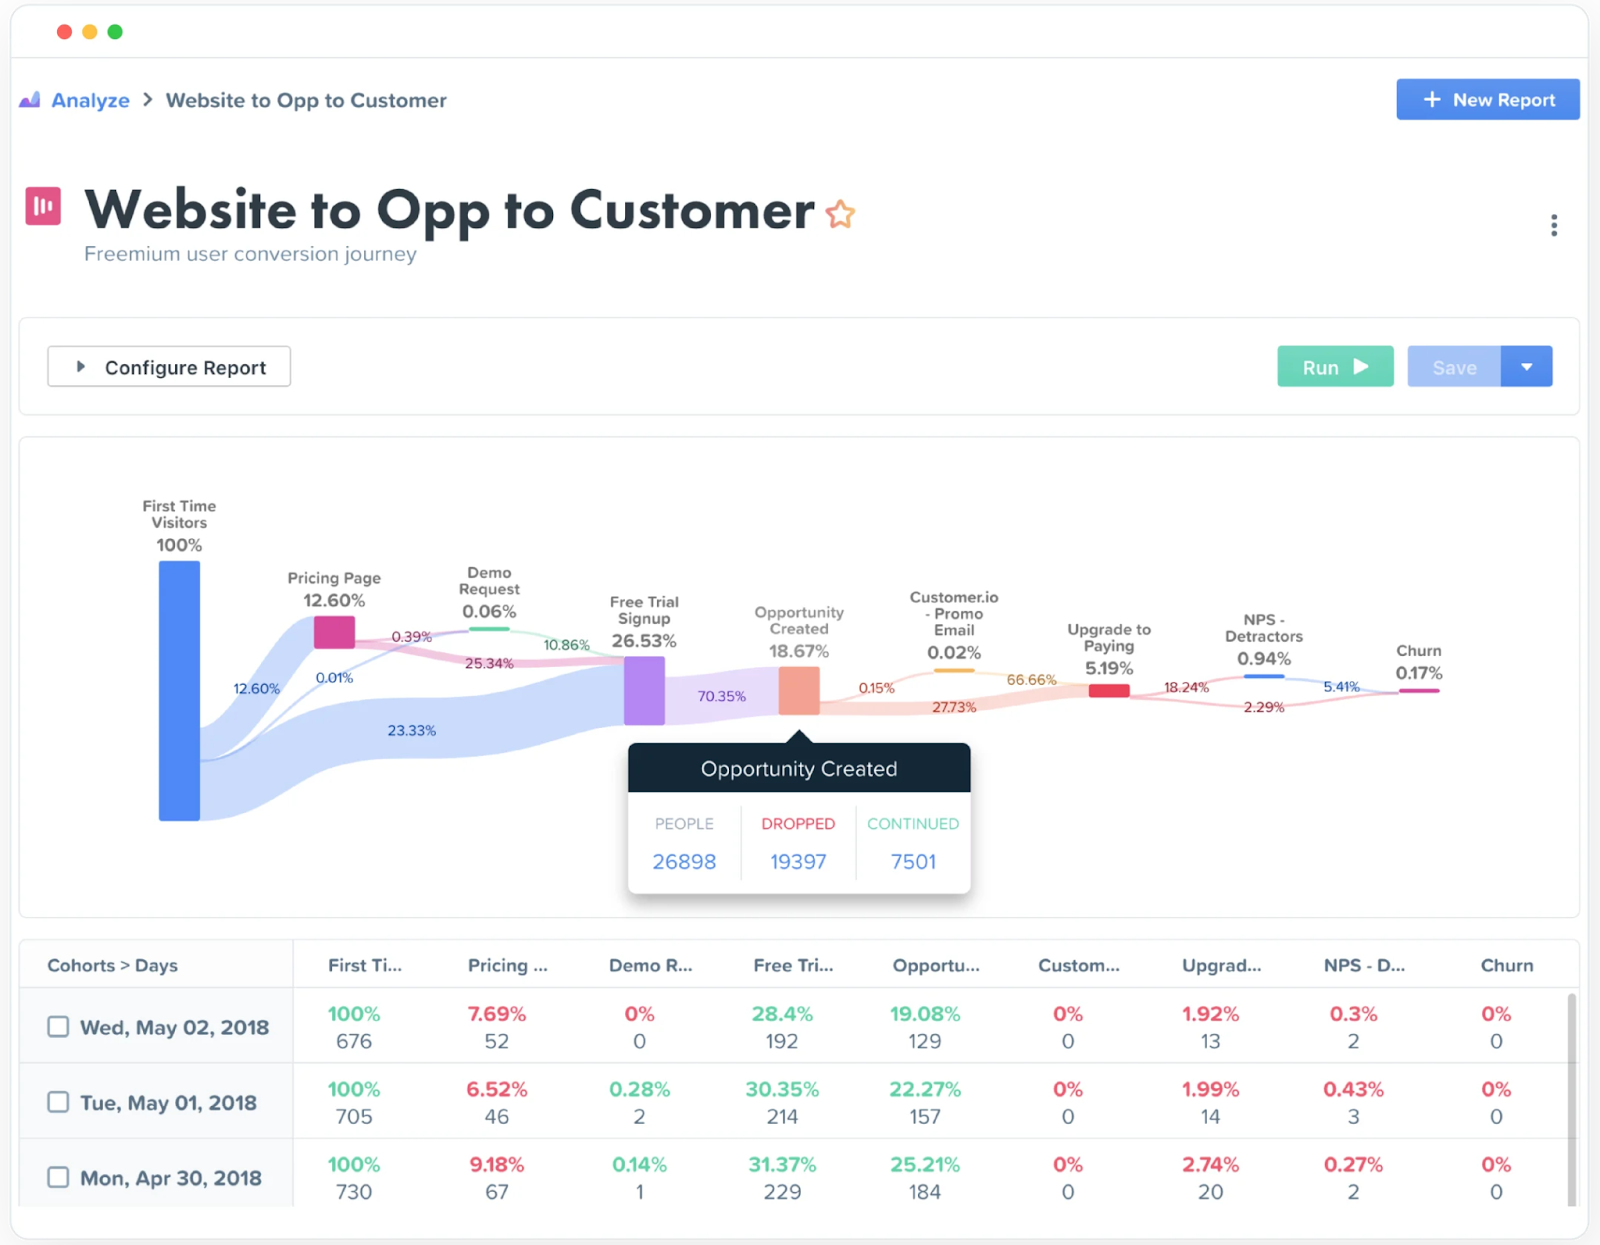
Woopra digital marketing analytics, for instance, offers easy-to-read reporting where big data is laid out visually so you can see what’s happening at every single point in the customer journey.
From the moment someone signs up for a free product version to when they complete their profile to when they use a core product feature to when they ultimately make a purchase, all of the interactions are right at your fingertips.
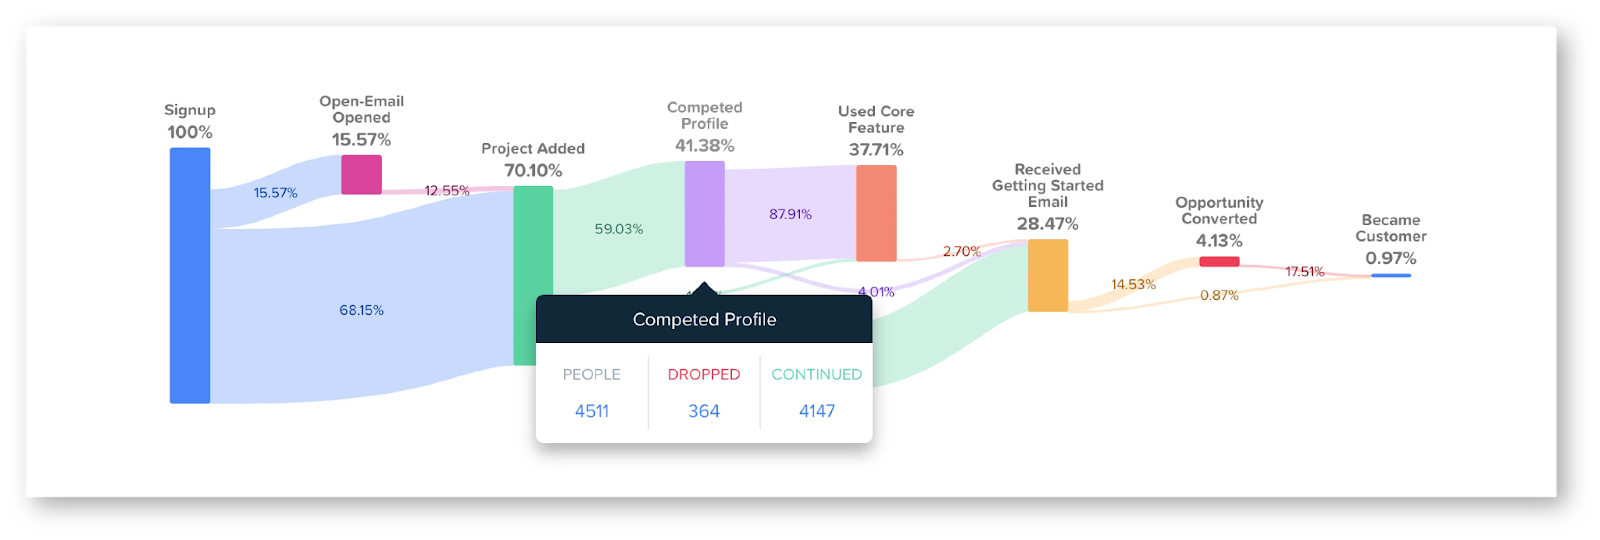
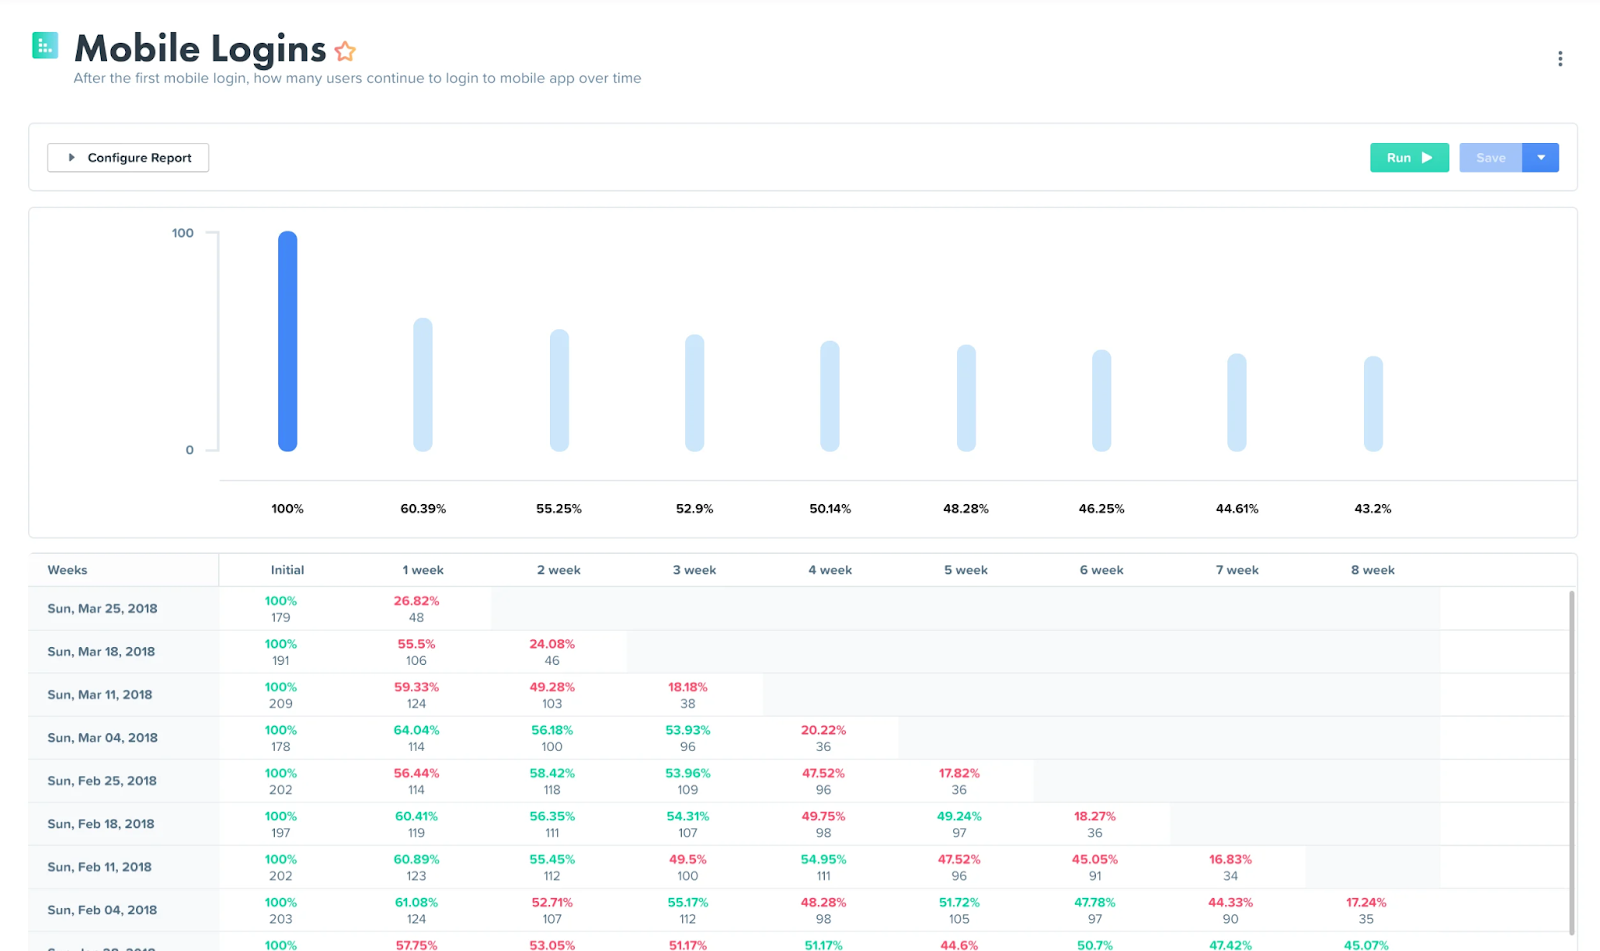
Besides that, Woopra can provide detailed insights into retention so you can see what percentage of users are sticking around and what your turnover rate is.
For example, you can quickly gather digital data on what the total number of mobile logins is over time.
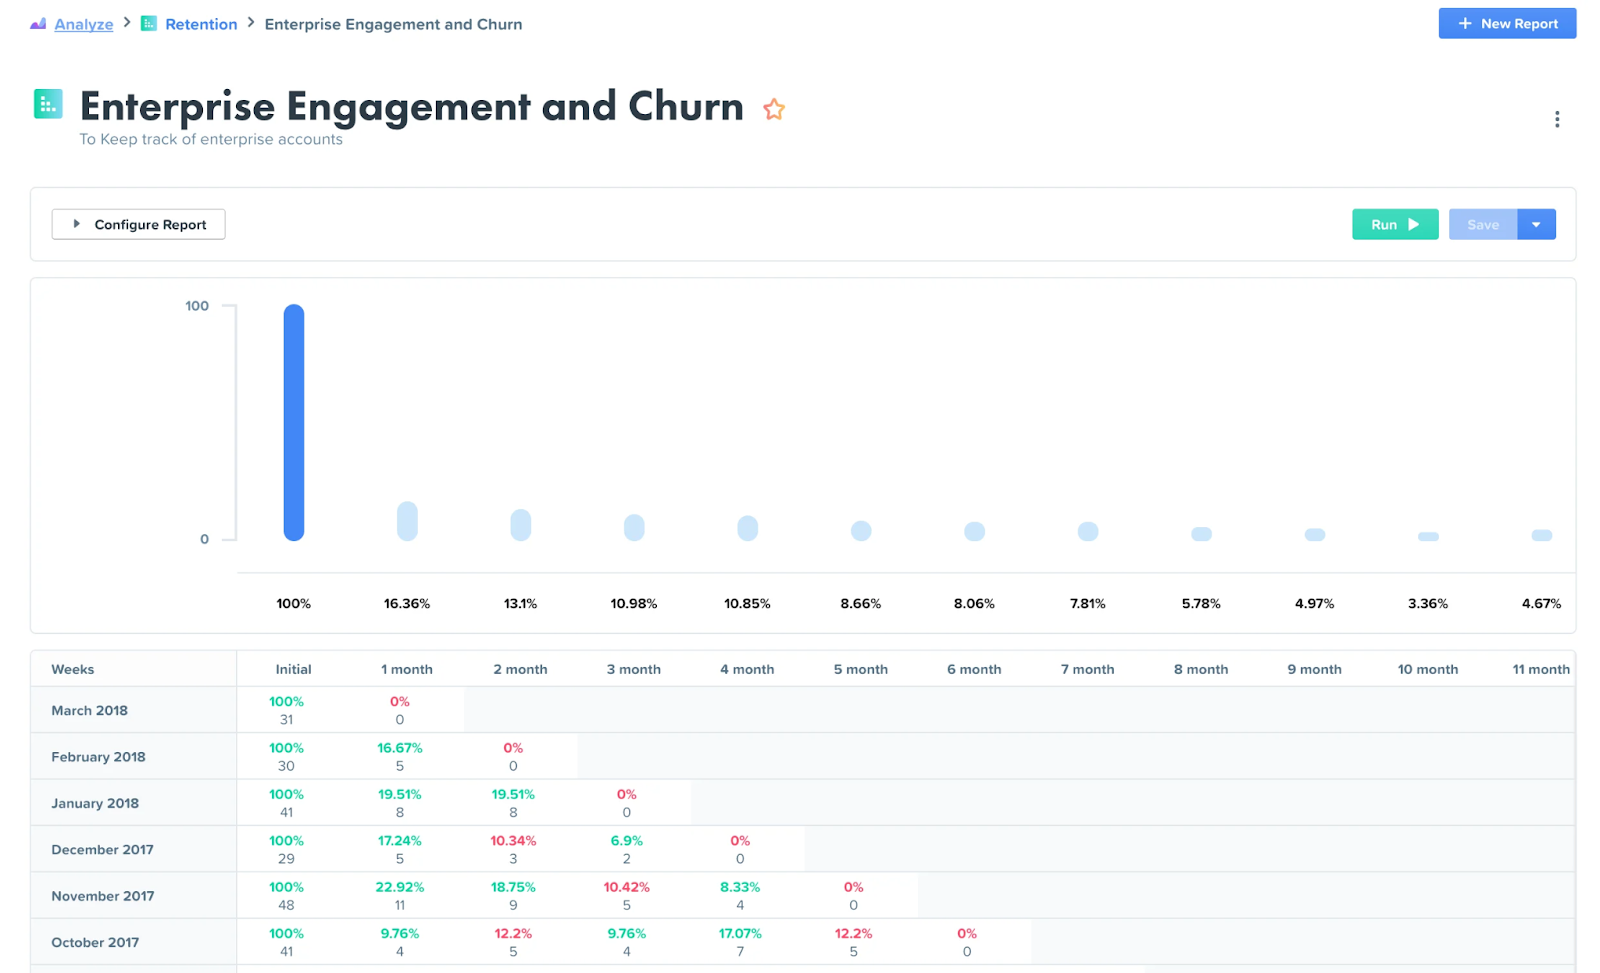
And you can see what your churn rate is.
Keep in mind that the number of applications with digital analytics is vast, and these examples are just the tip of the iceberg.
However, this should give you a general idea of some ways you can use digital analytics to gather insights and how that information can be used to optimize every single digital channel.
Digital Analytics Tools
Just as there are a wide array of sources that can be analyzed, there are countless digital analytics tools that can supply you with all the data you need.
And again, you don’t have to be a digital analyst to make sense of the data with most of these tools.
With that said, let’s go over some of the more popular analytics tools to cover the full spectrum of the customer journey.
Google Analytics
Source: Google Marketing Platform
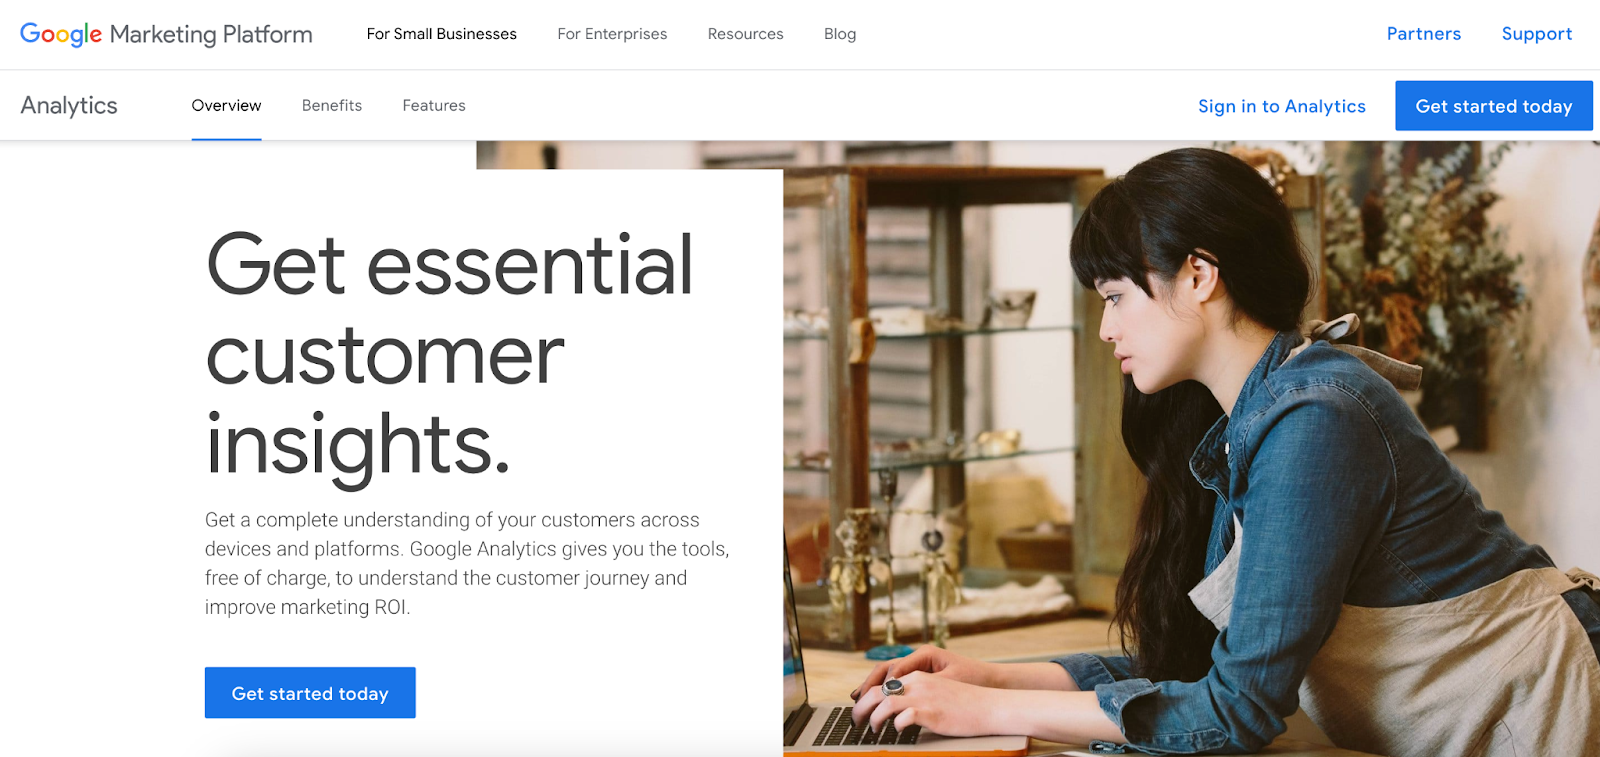
This is perhaps the best-known digital analytics tool and works well for providing a general overview of most website metrics, such as number of visitors, time spent on site, pages per session, bounce rate, and traffic sources.
It can also provide demographics information like visitor age, gender, and what device visitors use.
While Google Analytics doesn’t go as granular as some other tools like Adobe Analytics, it can be an excellent choice for businesses who simply need the basics. And given that the regular version is free, it’s perfect for those who are on a tight budget.
Even if you decide to use several other types of business analytics, it’s nice to have Google Analytics in your portfolio.
Woopra
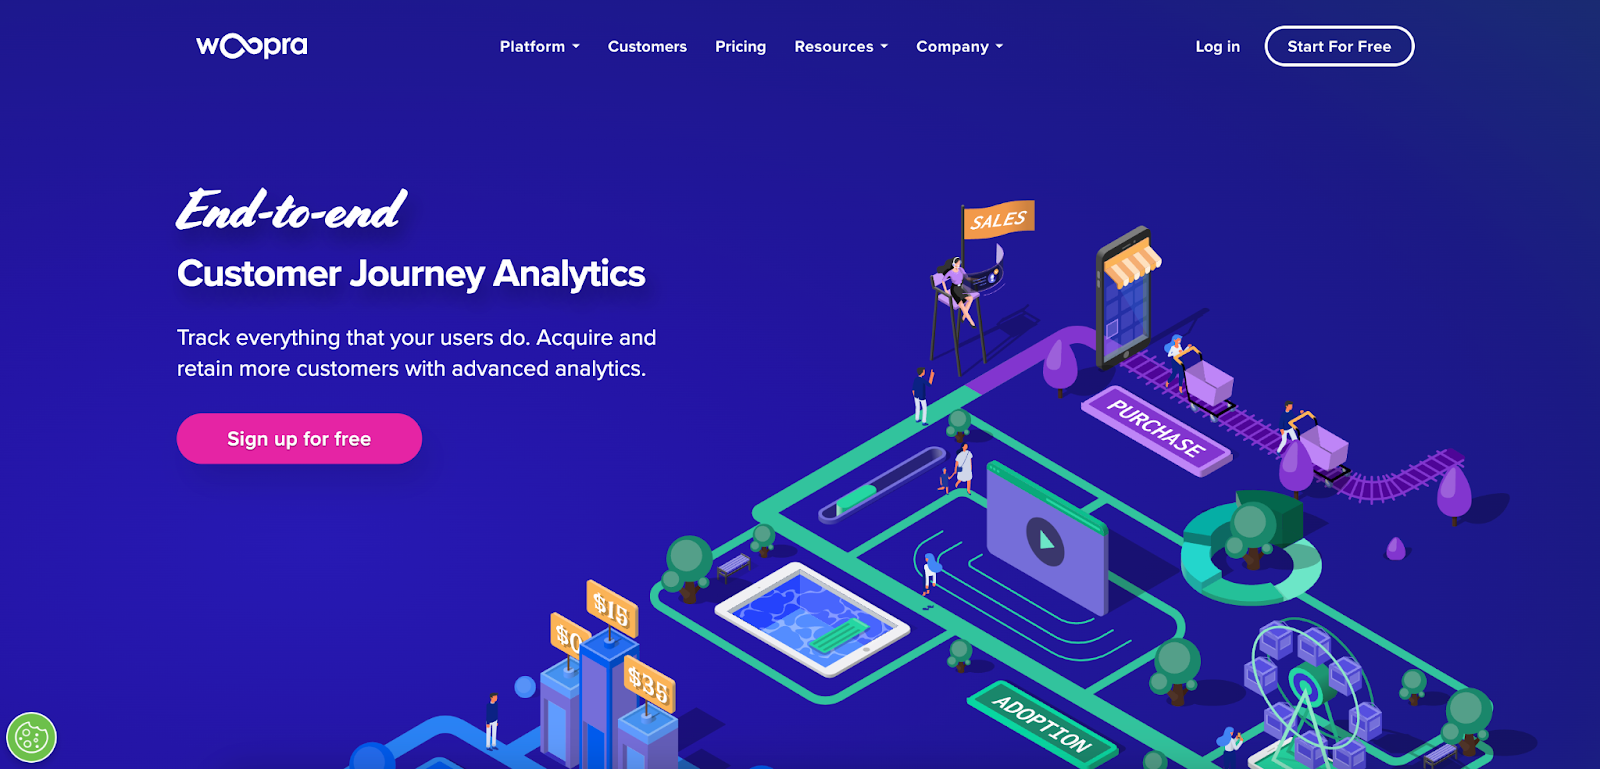
Woopra is all about multi-channel data collection and visualizing the customer journey from start to finish.
With it, you can track every touchpoint to see things from the customer’s point-of-view, so you can identify problem areas to correct as well as strengths so you’ll know what to double down on.
For instance, if you want to see all of the twists and turns that someone takes as they navigate their way from first learning about your brand to becoming a lead to buying to churning, Woopra gives you a bird’s-eye view of the entire process.
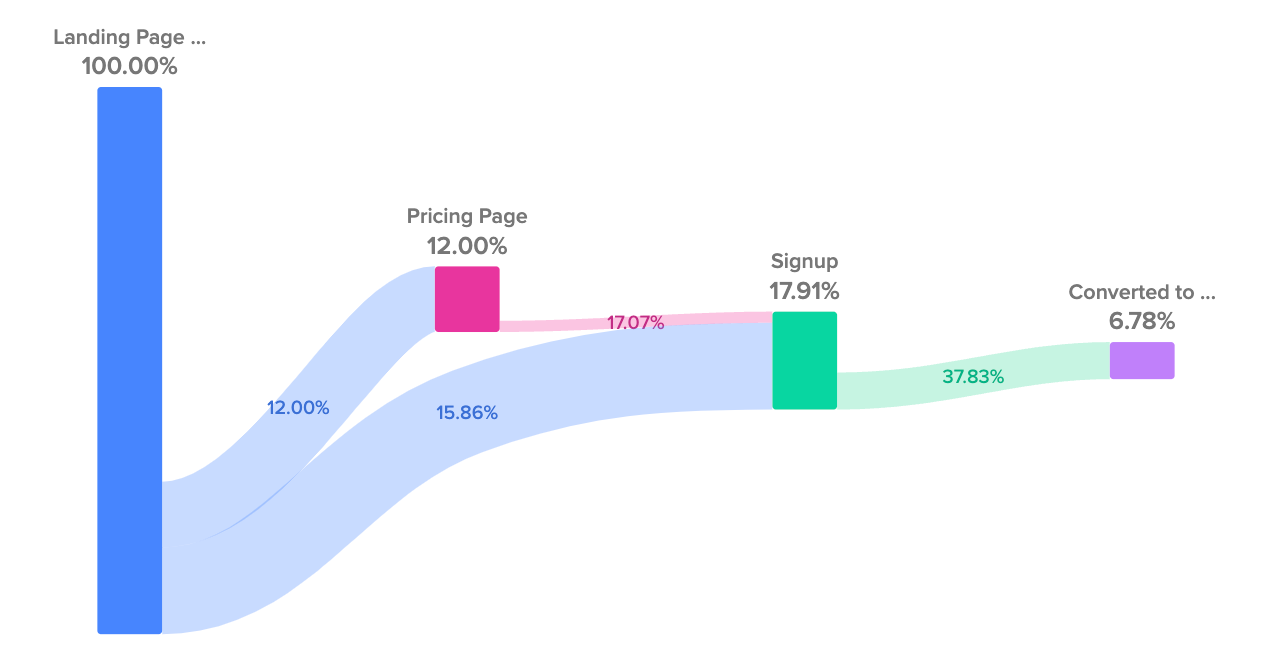
Or if you want to look closer at one particular part of the customer journey, like seeing how many users you converted from Google Adwords, you can do that as well.
And with a free Core plan for up to 500,000 actions per month, Woopra won’t break the bank.
Mailchimp
 Source: Mailchimp
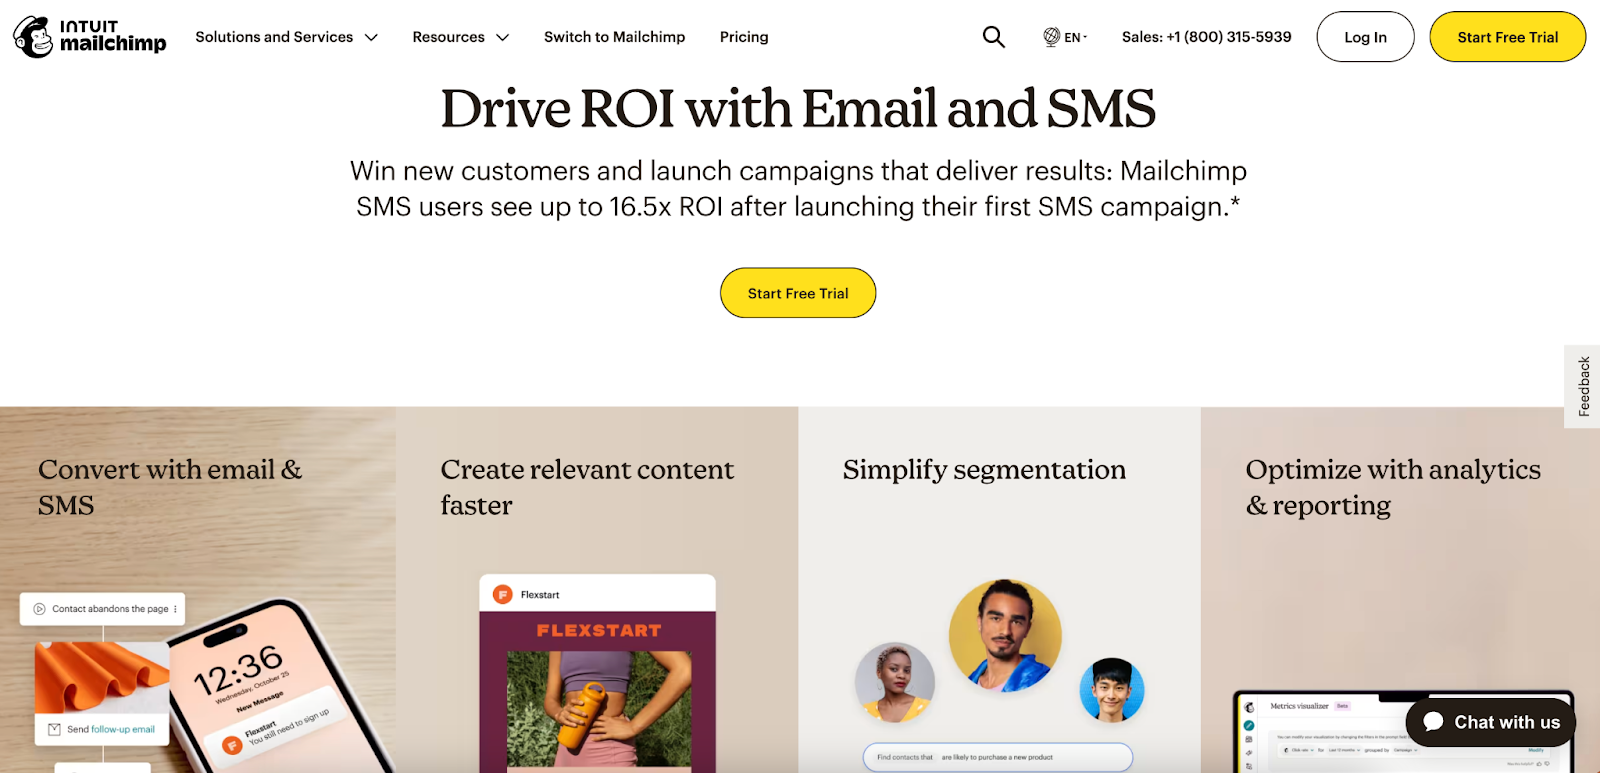
Mailchimp is the go-to email and SMS marketing analytics tool for many marketers. It specifically focuses on KPIs like:
- Open rate
- Click-through rate
- Bounce rate
- Forwards
- Shares
- Read time
- Conversion rate
- Unsubscribe rate
- List growth rate
While it’s by no means a general-purpose tool, it’s one of the best if you want to turn your email or SMS campaign into a well-oiled machine.
Mailchimp is also affordable, with the Standard Plan offering data on up to 500 contacts for just $20 per month.
Hootsuite
 Source: Hootsuite
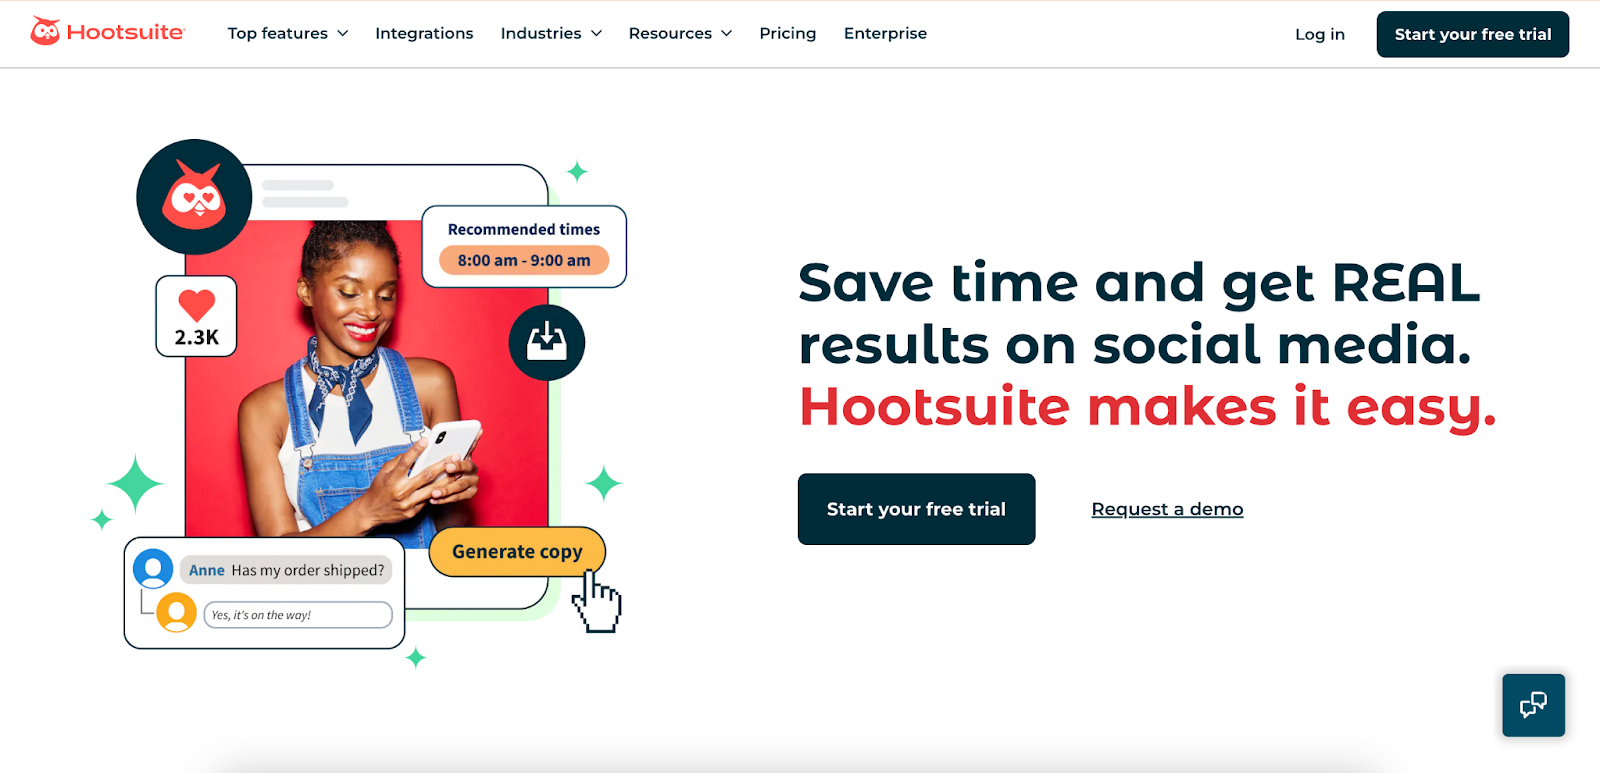
When it comes to analyzing everything social media-related, Hootsuite is one of the most trusted digital platforms in the industry.
With it, you can perform data analysis on practically every area of social media, tracking:
- Reach
- Impressions
- Engagement
- Mentions
- Click-through rate
- Follower growth
Hootsuite also offers sentiment analysis, where you can learn about how users feel about your brand, and predictive analytics to see what the future trajectory looks like.
Besides that, there are other helpful features like auto-publishing and scheduling to streamline content management and even generative AI for content creation. Pricing starts at $99 per month.
Crazy Egg
 Source: Crazy Egg
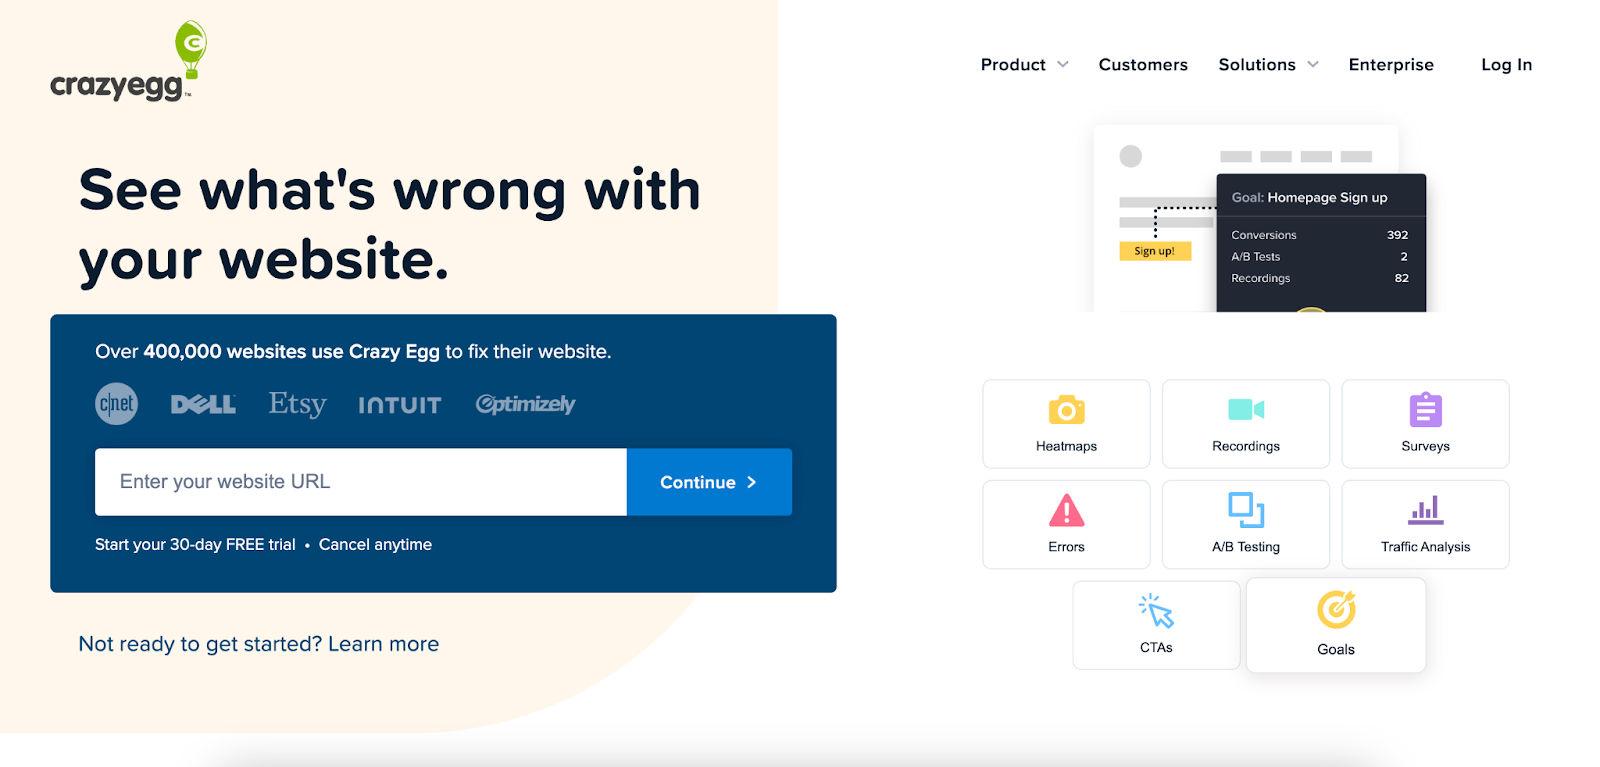
The main purpose of this product analytics tool is to show you how visitors are interacting with your site and what you can do to make their experience more satisfying.
One of the most popular features is heatmaps, which allow you to visualize which sections of pages receive the most attention and where users are clicking. Recordings let you see firsthand how visitors use your website.
And traffic analysis provides a rundown of the performance of different referral sources and landing pages. Also, Crazy Egg is fantastic for performing A/B testing.
Plans start at $99 per month.
Types of Digital Analytics: From Acquisition to Retention
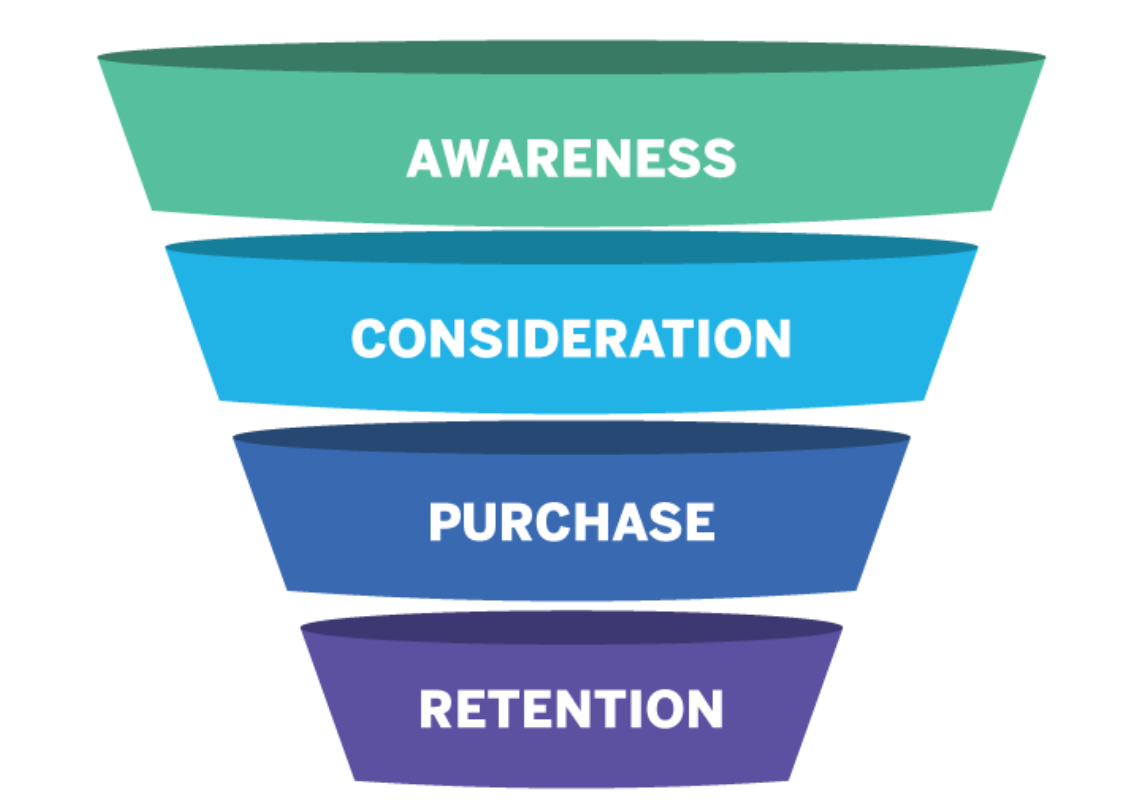
Throughout the customer journey, users move through a series of stages that typically look something like this.
 Source: Qualtrics
There’s the initial acquisition, or awareness stage, when a person first lands about your brand. There’s the consideration stage where they evaluate their options and compare your brand with others.
There’s the purchase stage where they choose whether or not to buy and complete their transaction. And there’s the retention stage where you build upon your relationship, establish loyalty, and continue to provide value long-term.
Now let’s break down the different types of digital analytics used throughout each customer journey stage.
During the acquisition stage, you’re focused on figuring out how people find out about your brand and where they come from.
To generate this data, you’ll typically look at traffic sources, such as organic search engine results, paid ads, social media, and referrals.
You may also perform keyword analysis to determine which keywords are bringing in the most traffic and which digital marketing strategies are getting the biggest results.
This can aid in future keyword research to ensure more qualified leads find your brand.
During the consideration stage, your goal is to analyze interactions and engagement to identify strengths and weaknesses.
For example, a high number of demo requests and content downloads would likely indicate that leads are moving smoothly through the consideration stage.
However, a low number could mean there’s an issue that needs to be fixed.
Maybe, for instance, leads have to fill out an overly lengthy form when requesting a demo. In that case, you would probably want to shorten it and only ask for essential information.
During the purchase stage, you’re looking at all of the angles to see what percentage of leads are resulting in an actual transaction and what you can do to increase that number.
The primary metric to analyze at this point is your conversion rate, as it tells you point blank what percentage of leads are becoming customers.
However, there are other important metrics to analyze as well, such as:
- Average order value
- Cart abandonment rate
- Cost per acquisition
- Preferred payment methods
Finally, during the retention stage, you’re focused on seeing what percentage of customers stick with you, how long they remain customers, and whether or not they make repeat purchases.
By generating retention stage data, you should A) be able to determine if your current retention rate is acceptable and B) what specific steps you can take to maximize it.
Some metrics to look at here include:
- Customer retention rate
- Customer churn rate
- Customer lifetime value
- Repeat purchase rate
- Purchase frequency
At the end of the day, the customer experience isn’t something that should be left to chance. And making it the best it can possibly be requires data driven decision-making.
Digital analytics provides the full spectrum of data needed so that you can cover all of the bases, ensuring a consistently positive customer experience while accelerating business growth.
Also, once you get in the groove with analytics, you can optimize your digital analytics for even more success.


