In the world of big data, two terms reign supreme—metrics and analytics. They're central to understanding, interpreting, and leveraging data. But what are they? And how do they work together?
This article examines the key differences between metrics and analytics. It explores their individual roles, their interdependence, and their collective impact on data-driven decision-making as a whole. With that said, let’s dive in to discover the power of metrics and analytics.
What Do Metrics Mean?
Metrics refer to quantifiable measurements used to track and assess the performance, progress, or success of a specific aspect of a business.
 Source: Investopedia
Metrics provide numerical values that can be compared over time against benchmarks or between different data sets.
They are often used to monitor key performance indicators (KPIs) and evaluate the effectiveness of strategies and initiatives.
A key performance indicator, by the way, is the quantifiable performance over time that helps an organization meet a business goal.
Metrics can be simple, such as a Google Analytics metric counting the total number of website visitors, or more complex, like calculating customer lifetime value.
Some examples include sales metrics, marketing metrics, and HR metrics.
By tracking metrics like these, businesses can gain insights into their performance and make data-driven decisions to fuel growth and improvement.
Types of Metrics
Metrics come in many forms and can be categorized into different types based on the specific aspect of business they measure. Here are some of the most common types of metrics:
- Financial Metrics: These assess the financial health and performance of a business. Financial metrics can include revenue, profitability, return on investment (an incredibly important metric), gross margin, and cash flow. They’re vital for providing insights into the financial success and sustainability of a business.
- Operational Metrics: Operational metrics focus on the efficiency and effectiveness of business operations. These metrics can include production output, cycle time, inventory turnover, and customer satisfaction. Operational metrics help businesses identify areas for business goal improvement, streamline processes, and enhance overall productivity.
- Marketing Metrics: This type of metric evaluates the productiveness of marketing efforts and campaigns. Some examples of marketing metrics include website traffic, Google Ad conversion rate, cost per acquisition (CPA), click-through rate (CTR), and customer lifetime value (CLV). The main purpose of marketing metrics is to provide insights into the ROI of marketing strategies and help optimize marketing performance.
- Customer Metrics: Customer metrics measure satisfaction, loyalty, and user engagement. These metrics can include customer satisfaction scores (CSAT), Net Promoter Scores (NPS), customer retention rate, and customer lifetime value (CLV). Customer metrics provide insights into the user experience for both new users and existing active users and help businesses better understand and meet customer needs.
- Social Media Metrics: These measure the impact and effectiveness of social network activities. They include metrics like reach, engagement, user interaction, follower growth, shares, and comments. Social media metrics help businesses gauge their presence, understand audience engagement, and assess campaign success.
- Employee Metrics: Employee metrics assess the performance, productivity, and satisfaction of employees. These metrics can include employee turnover rate, absenteeism, performance ratings, and training hours. Employee metrics help businesses monitor workforce effectiveness, identify areas for improvement, and optimize human resource strategies.
By utilizing different types of customer journey metrics, businesses can gain comprehensive insights into nearly all aspects of operations, enabling them to make data-driven decisions and drive success across the board.
It’s the raw data produced through metrics that paves the way for customer journey analytics and other forms of analytics, which brings us to our next section.
What Do Analytics Mean?
Analytics is a systematic method. It deals with data — raw, complex, and disordered — and makes sense of the chaos, creating a new dimension of understanding. Google Data Studio, which offers web-based visualizations of Google Analytics metrics via an intuitive, user-friendly dashboard is a great example.
The goal? Unearthing patterns and insights. Discovering trends that might have stayed hidden, analytics turns data from confusing to comprehensible.
A simple example could be determining what percentage of SaaS users return over time after using a core product feature, allowing a business to gauge long-term customer behavior.

It's all about interpretation. Data analytics tries to answer the "why" behind the data of each key metric.
- Why are sales dropping?
- Why is one website performing better?
- Why is the daily active user number increasing?
- What’s contributing to the monthly active user count improving?
It digs deep to find these types of answers.
And this process isn't random. It's rigorous and based on established methods.
Statistical analysis, predictive modeling, and machine learning are all tools in its arsenal.
Analytics also helps in strategic planning. It uncovers actionable insights on a specific metric, which allows businesses to make informed, data-driven decisions.
It's crucial in our modern, data-rich world, and all sectors rely on analytics, as it helps them optimize operations and strategize effectively.
Here are some specific types of analytics:
- Web analytics
- HR analytics
- Marketing analytics
- Product analytics
- People analytics
And analytics isn't just about large datasets. It applies to small-scale scenarios as well, such as micro-budgeting.
In terms of analytics platforms for data collection, Adobe Analytics and Google Analytics are some of the best known. Note Google Analytics 4 is the current version of the platform, which replaced Universal Analytics in mid-2023.
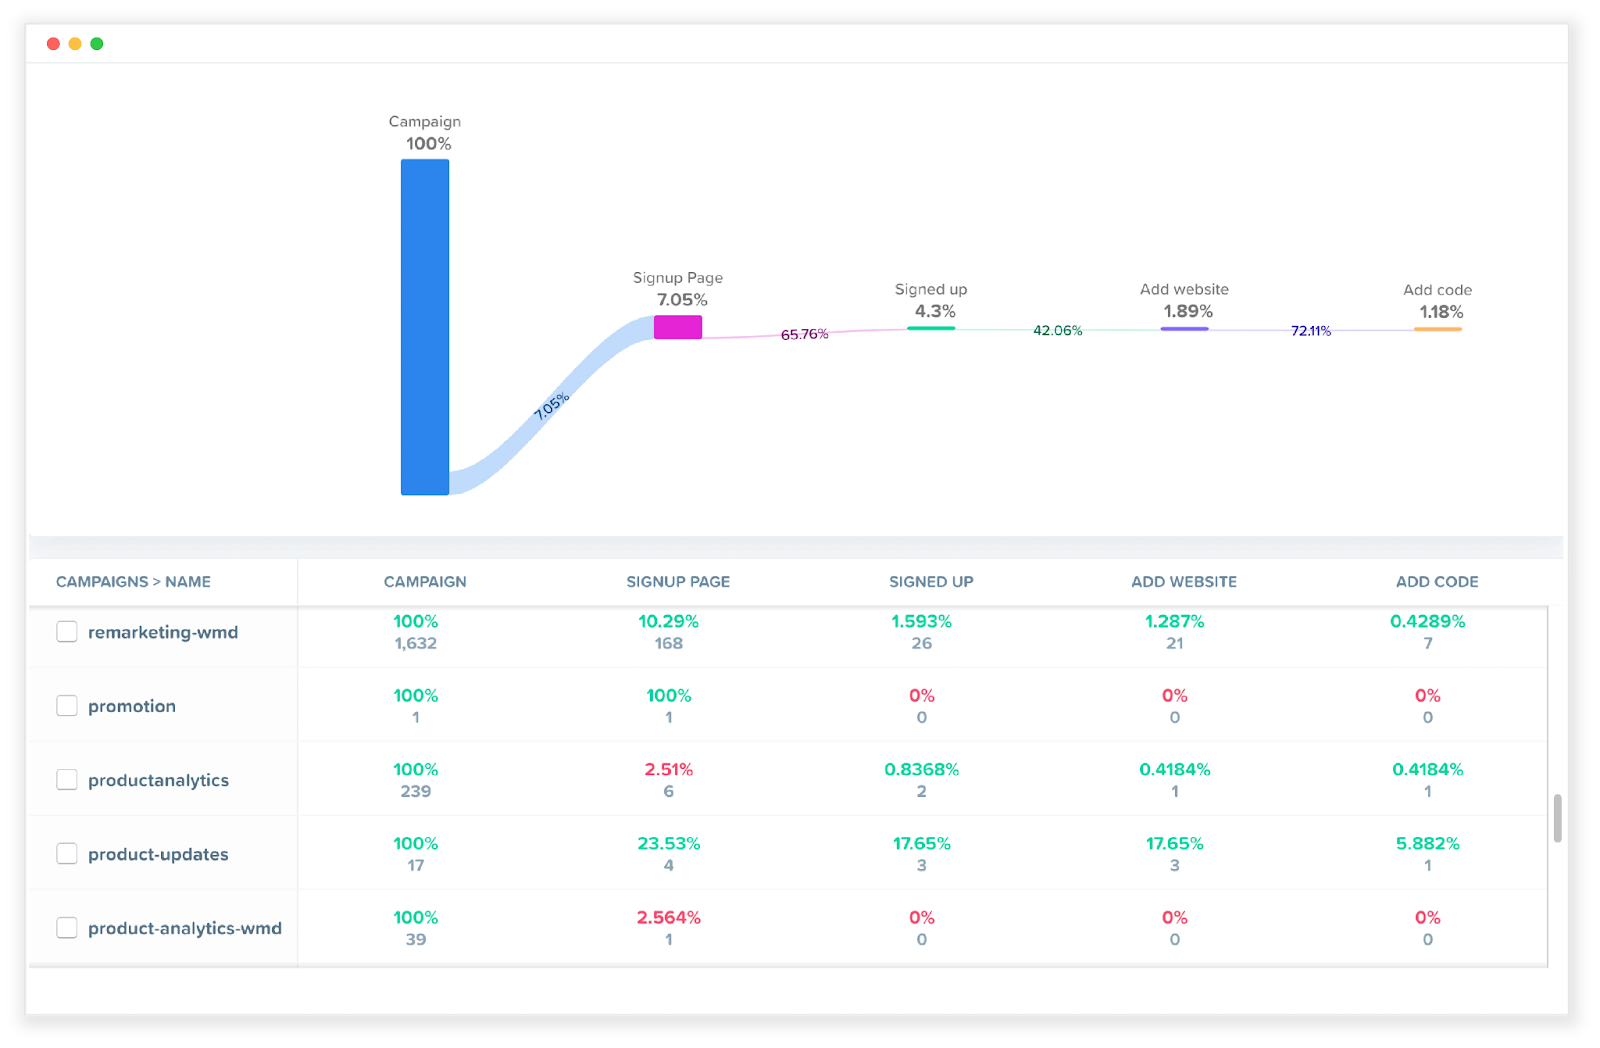
However, another analytics tool that can be helpful to many modern businesses is Woopra, which offers customer journey analytics.
This is perfect for getting a big-picture view of the steps someone takes from being a first-time visitor to a lead to a customer and beyond.
 Source: Woopra
In conclusion, analytics gives meaning to data. It provides a structured interpretation of the information and makes sense of the noise, which is why it’s such a powerful tool for understanding and leveraging information.
Types of Analytics
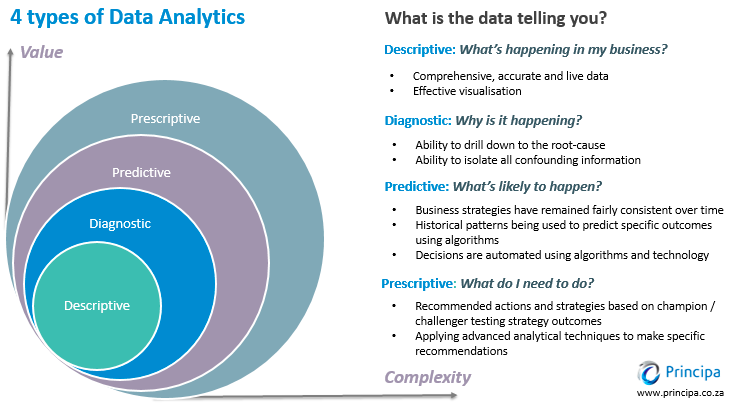
There are four main types of analytics — descriptive, diagnostic, predictive, and prescriptive. Each one provides a unique lens to view data.
- Descriptive Analytics: Descriptive analytics examines past data. It gives an overview of what has happened and is the first step in data processing. Sales reports, website traffic, and inventory levels are all examples of descriptive analytics. In short, they provide a summary of past events, but they don’t explain why things happened.
- Diagnostic Analytics: Next comes diagnostic analytics. It delves deeper into past data and tries to uncover why something happened. Diagnostic analytics looks for dependencies and patterns and relies heavily on drill-down, data discovery, and correlations. It gives actionable insights into specific issues.
- Predictive Analytics: Predictive analytics focuses on the future. It uses past data to forecast future trends and answers the question of what might happen next. Predictive models use statistical techniques and machine learning to predict future outcomes based on historical data. It's not 100% accurate, but it's a solid educated guess.
- Prescriptive Analytics: This is the most advanced type of analytics. It goes beyond predicting future outcomes and suggests a course of action. Prescriptive analytics uses optimization and simulation algorithms to present multiple solutions for a future scenario. It's like having a GPS for decision-making.
 Source: TechTarget
Each type of analytics is crucial. They complement each other, offering a holistic view. From understanding the past to strategizing for the future, analytics is key to understanding how the pieces fit together.
Optimize for Conversion & ROAS Now! Explore Woopra in a demo and enjoy a 2-week free trial: https://www.woopra.com/demo
Metrics vs Analytics - Key Differences
At first glance, metrics and analytics may seem interchangeable. But they have distinctive roles in the world of data.
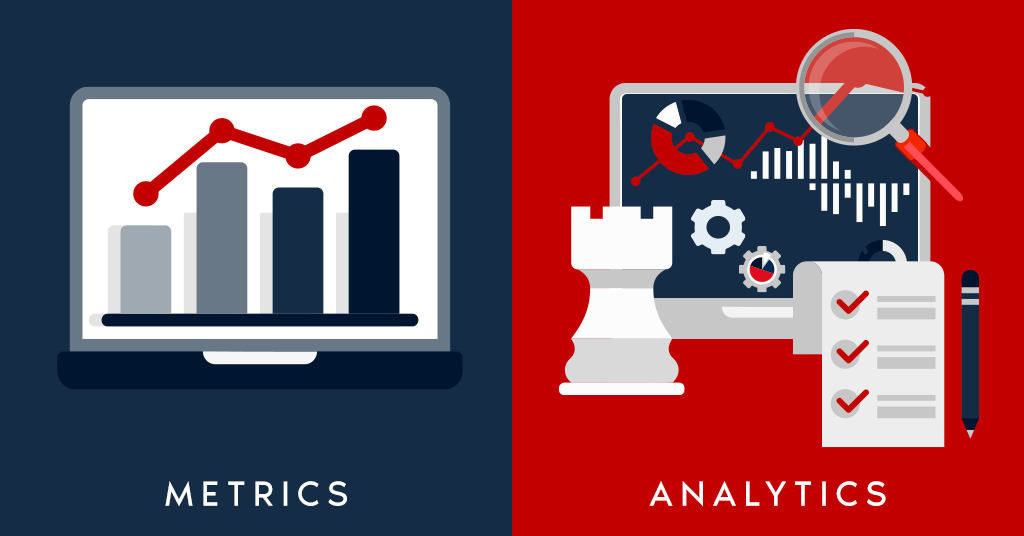
Metrics are quantitative measurements. They represent raw, unfiltered data. They are the specific numbers or stats, like website visitors or sales conversion rates.
On the other hand, analytics is about interpretation. It gives context to those raw metrics and transforms them into meaningful insights.
 Source: SearchworxX
Metrics tell you "what" is happening. They reveal performance facts without delving into causes. They provide a snapshot — a piece of the overall picture.
Conversely, analytics tells you "why" something is happening. It uncovers the underlying reasons behind the data. It seeks to understand trends, patterns, and relationships in the metrics.
Metrics are generally simple and straightforward. They are tangible and can be easily tracked. For instance, the number of new customers is a clear, quantifiable metric.
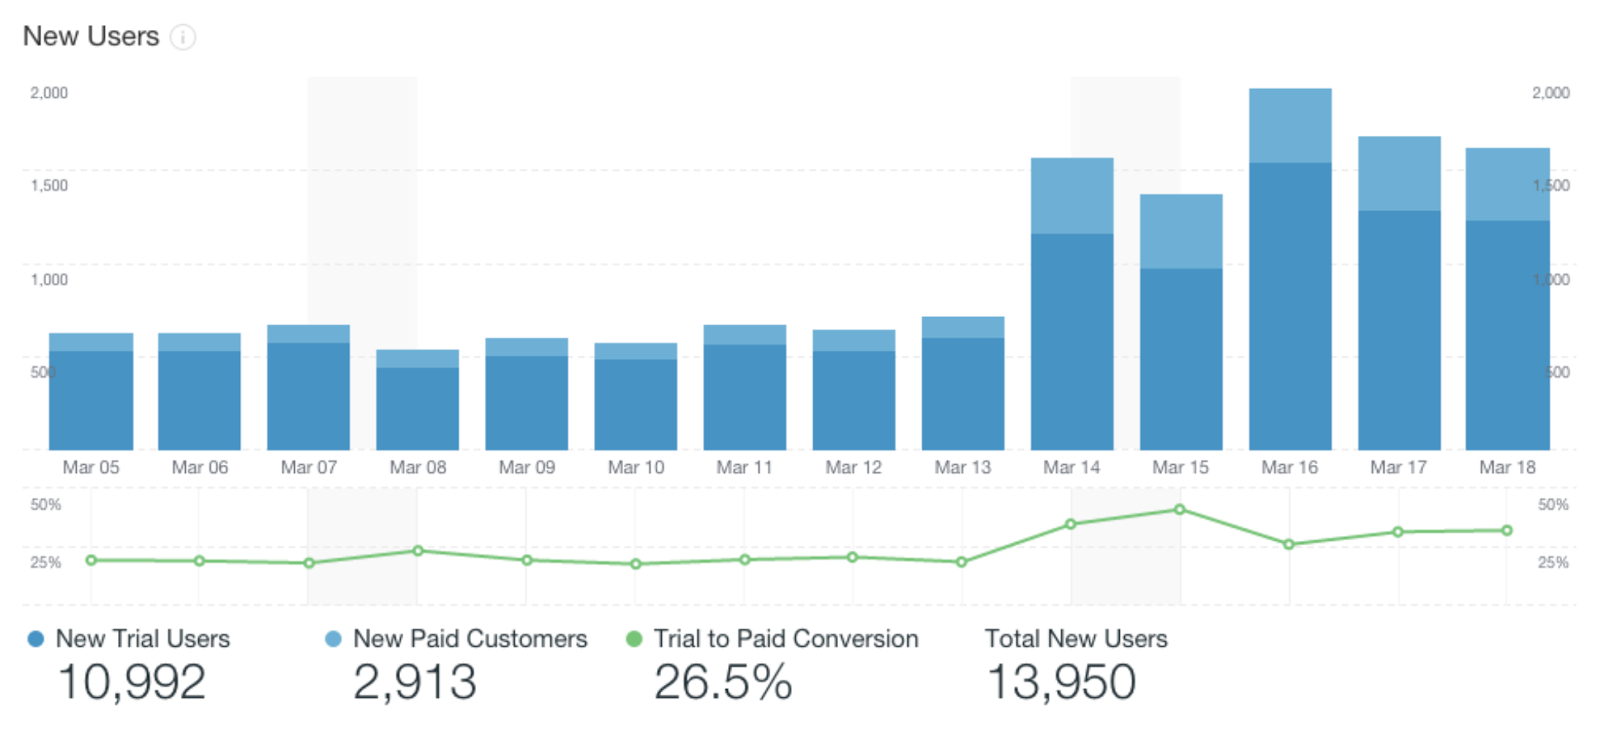 Source: DevMate
Analytics, on the other hand, can be more complex. It often involves various statistical methods or predictive models. It involves sifting through layers of data to discover deeper truths.
Moreover, metrics are singular data points. They exist in isolation. Analytics, however, is about connections. It connects the dots between different metrics.
In summary, metrics provide the raw data, and analytics gives life to this data, making it actionable. They are two sides of the same coin, each playing a crucial role in data analysis.
And the data generated with metrics is crucial to ultimately maximizing your business success with customer journey analytics.
How Are Metrics and Analytics Interdependent?
Metrics and analytics are closely intertwined. They play different yet complementary roles in data management.
Metrics are the raw inputs for analytics. They provide the initial data — the building blocks. Without metrics, analytics wouldn't have anything to interpret or analyze.
Metrics also capture discrete data points and track the progress and health of a business. Examples include customer engagement, sales volume, or server downtime. But alone, metrics only tell part of the story.
That’s where analytics steps in. It takes these raw metrics and gives them context. It looks at the relationships, patterns, and trends within the data.
Metrics might tell you that sales have fallen, but analytics explains why. Analytics also looks at other related metrics like user behavior or market trends to dig into the root cause.
Together, metrics and analytics offer a complete picture. They turn raw data into meaningful, actionable information. They provide both the "what" and the "why".
It’s also important to note that this relationship is a cycle. For example, analytics may suggest new metrics to track. Or, changes in metrics can influence the focus of analytics.
The bottom line is that metrics provide the data, and analytics interprets it. They're two halves of a whole, driving data-driven decision-making.
It's through their synergy that businesses can truly harness the power of data without the need for a formal data scientist.
Conclusion
In a nutshell, metrics and analytics are partners in data analysis. Metrics provide the raw data, while analytics brings meaning to it.
Together, they transform data into valuable insights and empower data-driven decision-making. That’s why mastering both is vital in the age of big data.


