Scroll depth doesn’t get talked about as much as some other key web analytics metrics, but if you’re looking to increase conversions, it’s a meaningful metric to track.
It’s also one of the most simple marketing analytics techniques for tracking on-site behavior, making it a good first step for new marketers who are looking to expand their analytics expertise beyond basic onsite metrics like pageviews and bounce rate.

Why Is Scroll Depth Important?
Let’s start by answering an even simpler question: What is scroll depth?
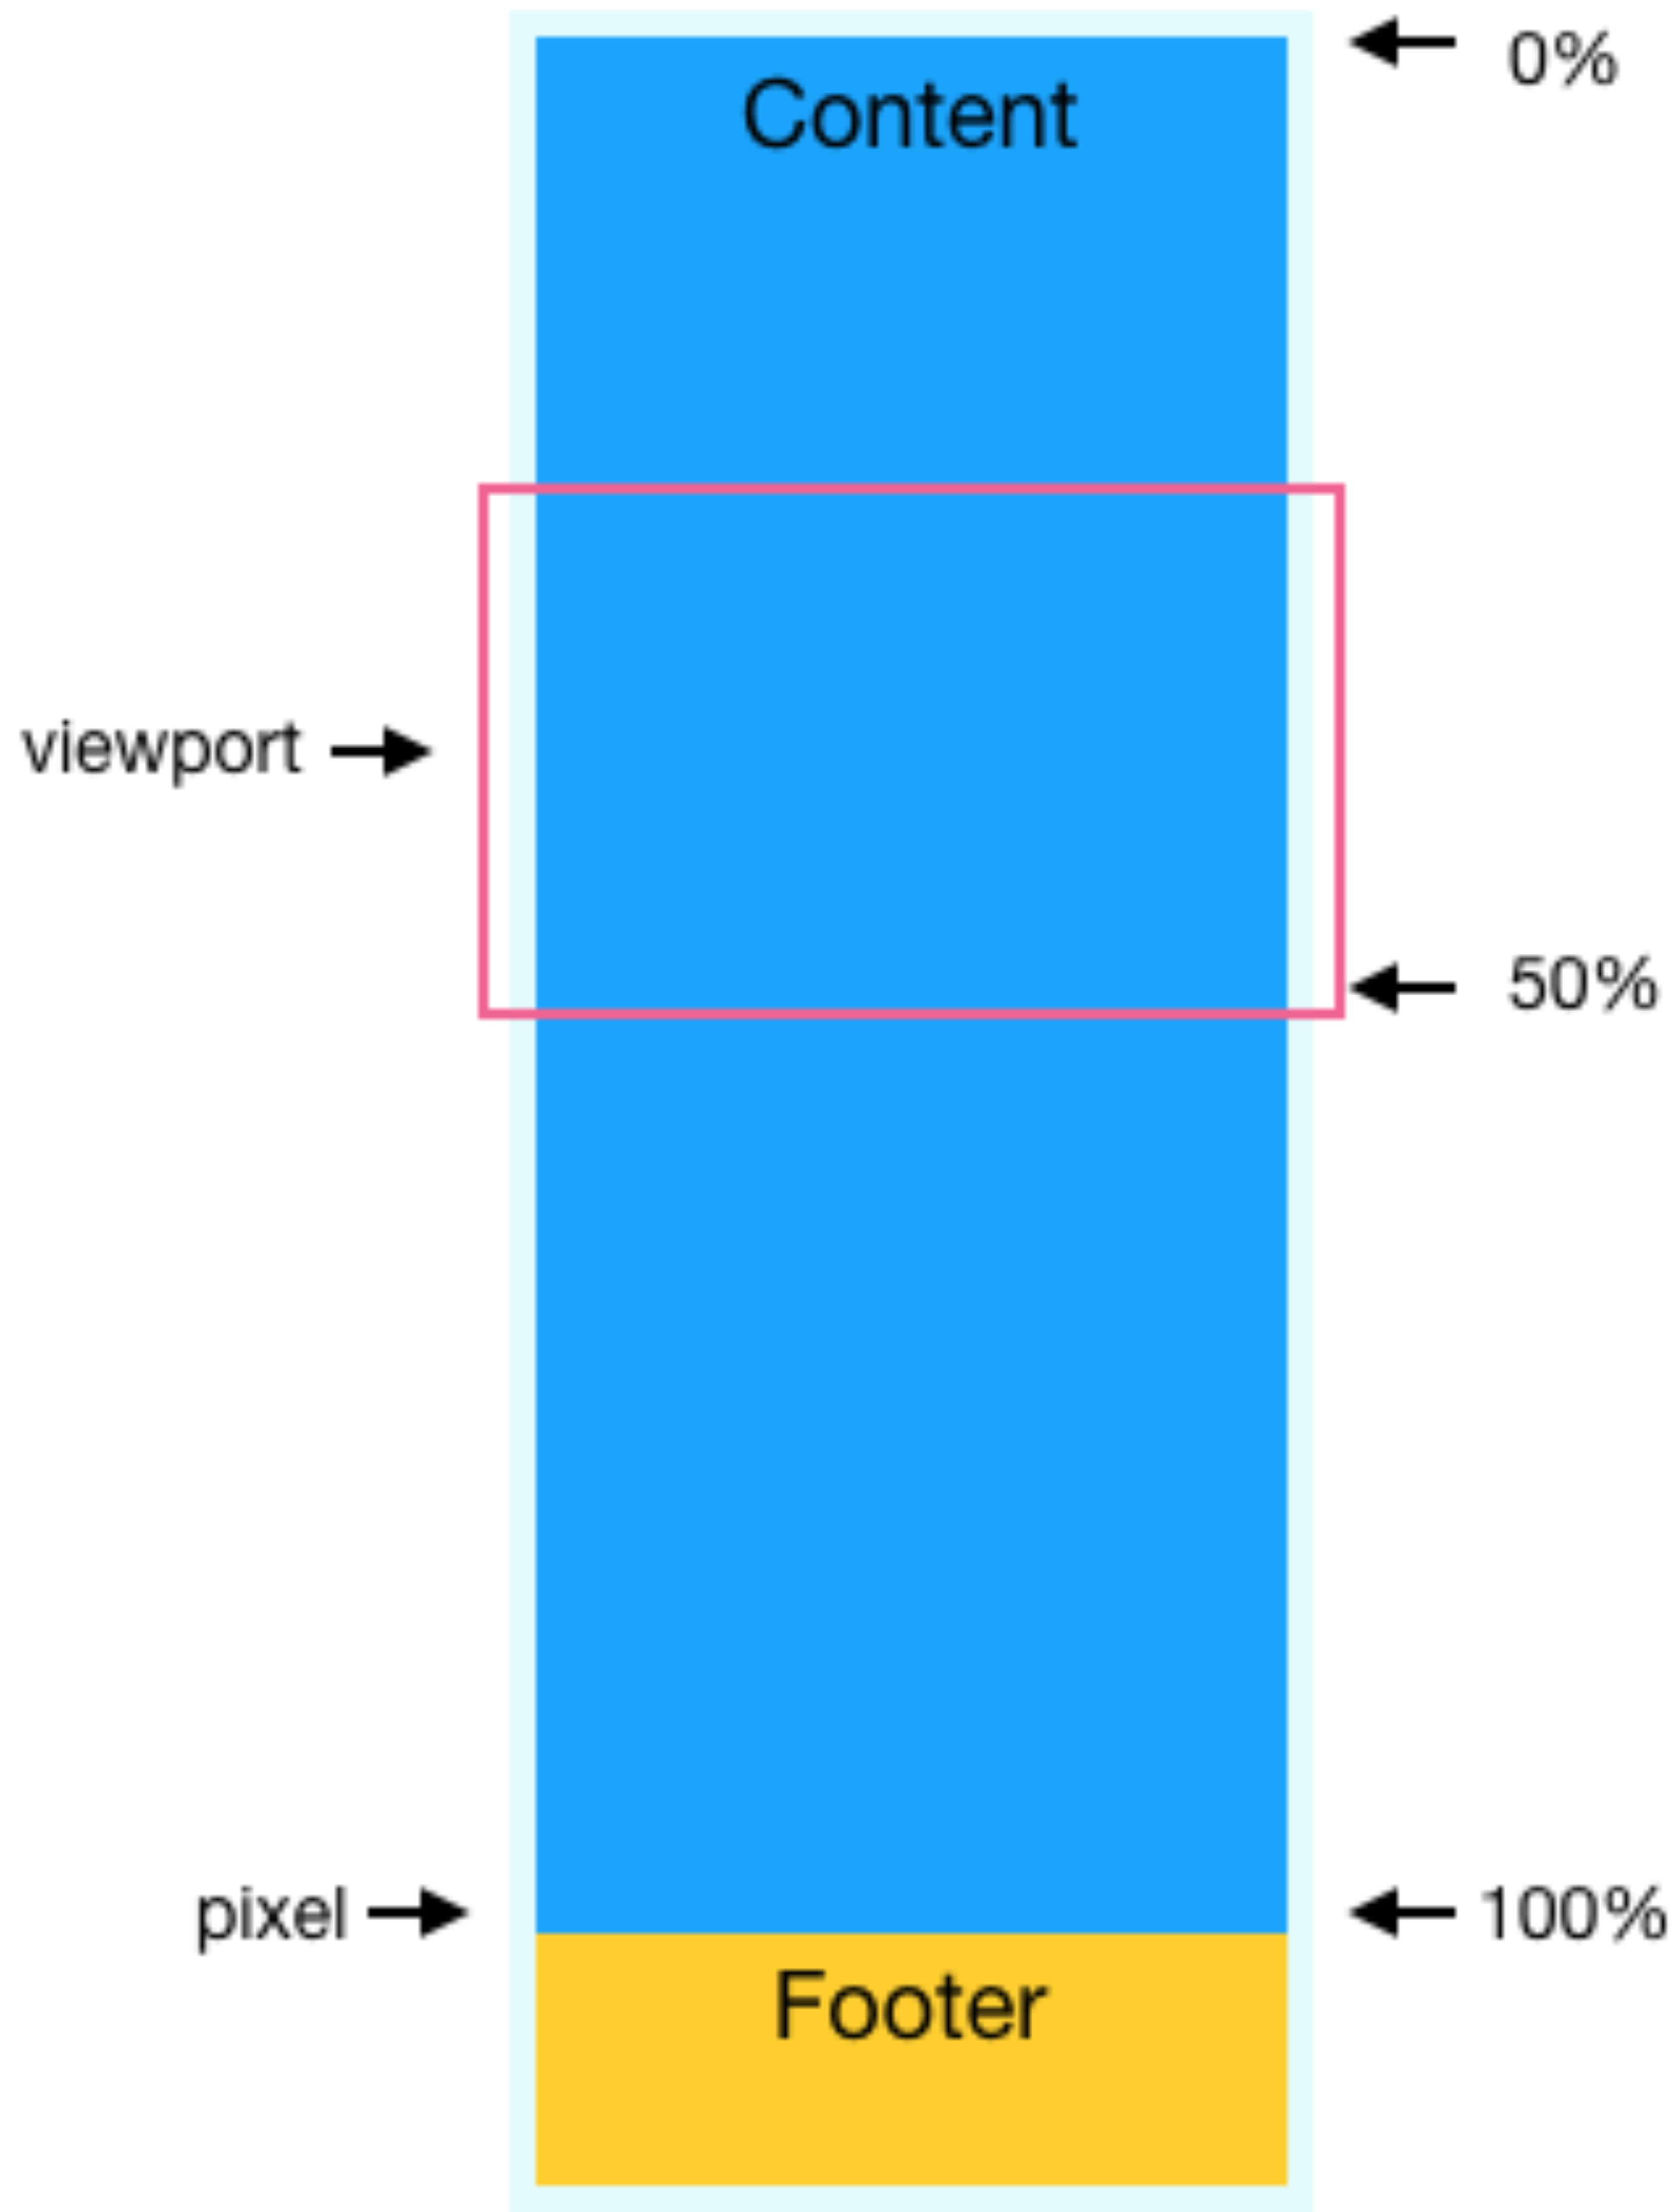
Scroll depth is a measurement of how far a user scrolls on a page. It’s typically measured as a percentage of the total page content. For example, if a user were to scroll halfway down a page and then leave, that user’s page session would have a scroll depth of 50%.
 Source: Optimizely
Page scroll depth can also be measured in pixels. When measured this way, it’s sometimes also called pixel depth. Pixel depth values are typically rounded, so a user who scrolled 5,132 pixels down the page might have a reported pixel depth of 5,000.
Percentages remain the more common scroll depth units, so you’re more likely to see them used in scroll tracking tags, tools, and discussions.
Scroll depth can also be measured in terms of either horizontal scroll or vertical scroll direction. Although, the vertical scroll depth is what’s most frequently measured and reported since most web pages are oriented vertically.
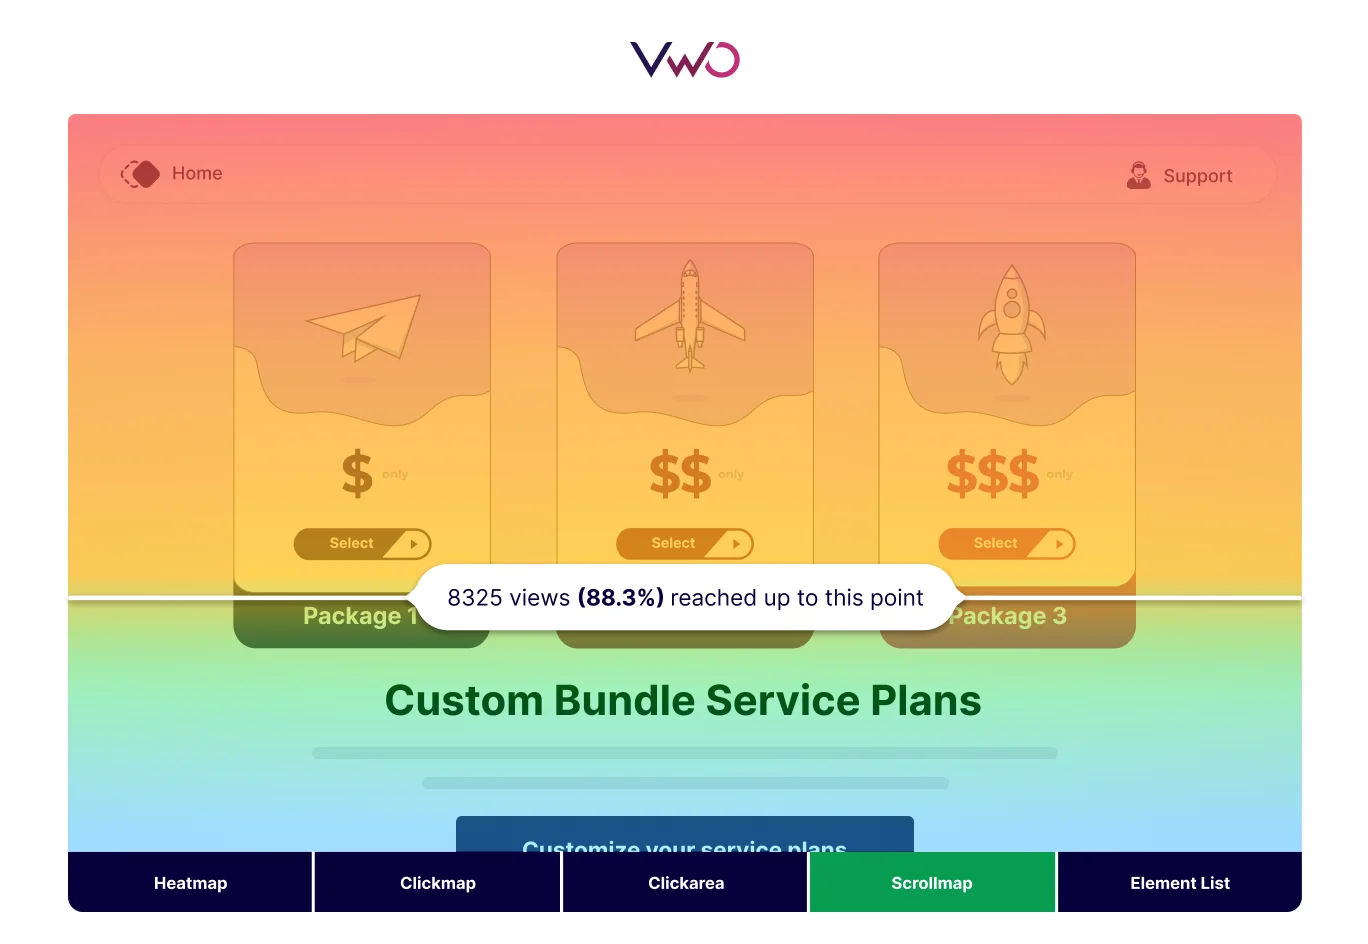
Ultimately, a scroll map tells us about element visibility: What parts of the page did our visitor actually see along the page path?
 Source: VWO
Now that we understand what it is, we can see why scroll depth is important: It’s a simple metric that gives us an idea of how far a user got into a page or a piece of content before leaving. That’s valuable insight we can use to analyze the effectiveness of our pages and ultimately enhance the user experience.
For example, imagine we’ve published a piece of long-form content, and we see that the page has a high bounce rate. Looking at the scroll depth can give us more insight into what’s actually happening.
If we see low scroll depth, that might indicate that visitors don’t like the content and aren’t reading it — time for a rewrite.
On the other hand, if we see high scroll depth numbers, then we know visitors are scrolling through the content and then bouncing. Maybe the CTA at the end of the page needs to be improved.
What Is a Good Scroll Depth?
As is probably clear from the previous example, what qualifies as a good scroll depth is dependent on the content you have on the page. There is no universal scroll depth benchmark.
Also Read: The Most Important Web Analytics Metrics to Track
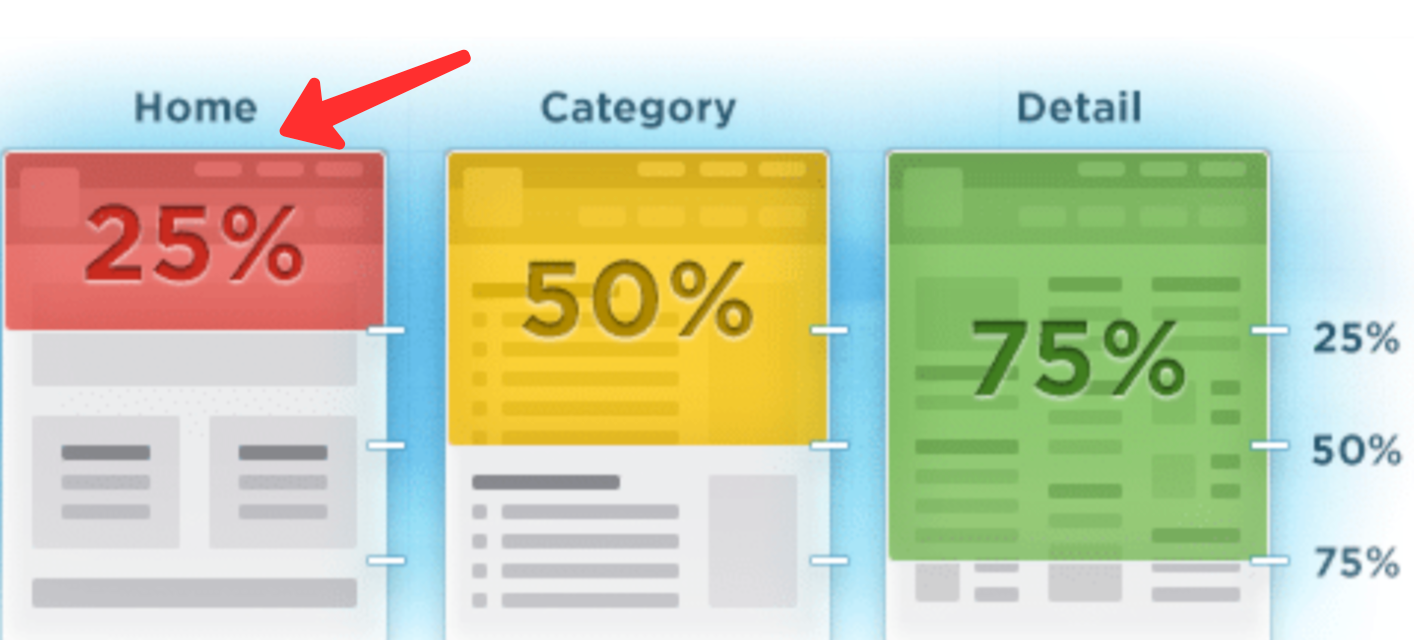
On a company homepage with a large CTA above the fold, a low scroll depth such as 25% is a good thing, as long as it’s paired with a low bounce rate. It indicates that users are landing on the site and clicking on the CTA more or less immediately.
 Source: Blast Analytics
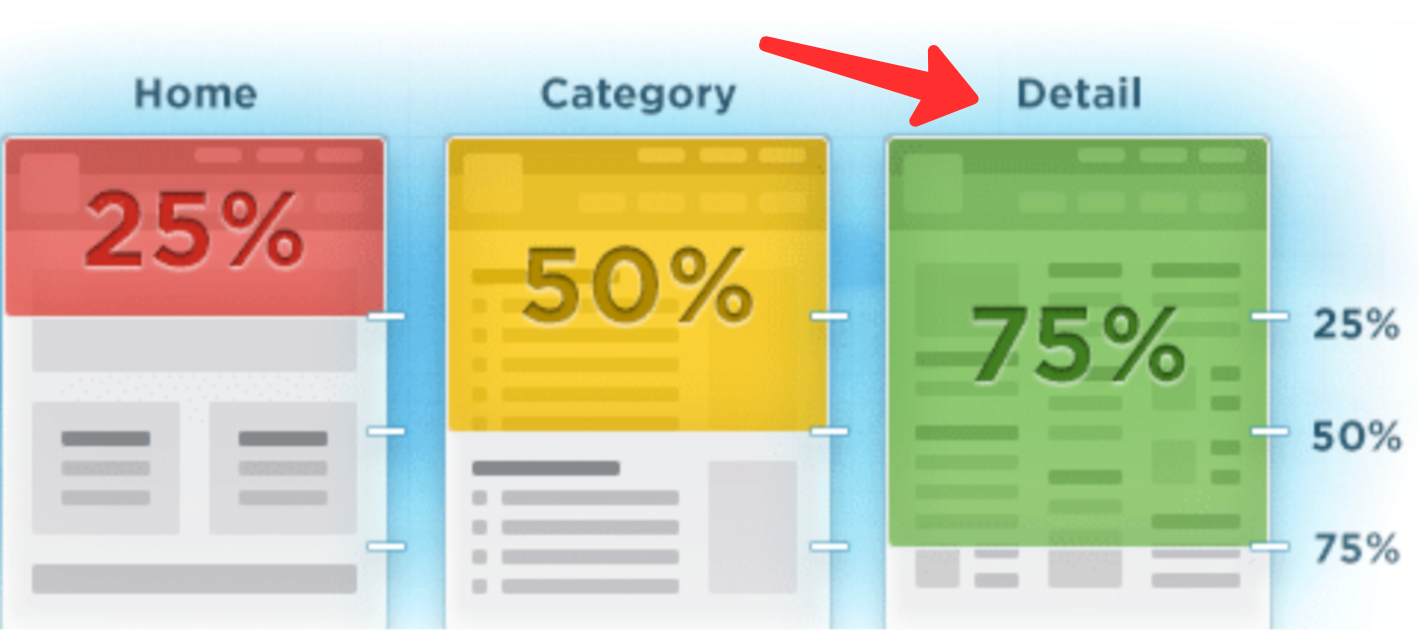
On the other hand, in a piece of long-form content, an average scroll depth of 25% would be very disappointing — that would mean that very few visitors are actually reaching the end of the content. 75% is a solid page scroll depth tracking target for long-form content.
 Source: Blast Analytics
It’s also important to point out that most scroll tracking options are imprecise because they use a few on-page scroll depth triggers at key points to fire events that are recorded in your analytics software.
For example, a page might have scroll depth triggers at the 25%, 50%, 75%, and 100% scroll points. If a user scrolls 38% down the page, that’ll be recorded as a scroll depth of 25%, since they never reached the trigger at the 50% mark.
It’s important to factor this reality into your thinking when you determine what a good scroll depth is for your page. If a key page component appears at the 40% mark, for example, you might even want to adjust your scroll depth triggers so that one fires at that 40% mark.
Optimize for Conversion & ROAS Now! Explore Woopra in a demo and enjoy a 2-week free trial: https://www.woopra.com/demo
How to Track Scroll Depth in Google Analytics
If you’re doing your digital analytics using Google Analytics and Google Search Console, you’ve probably noticed that the default Google Analytics dashboards do not include page scroll depth. However, there are a few different ways you can implement scroll tracking in Google Analytics.
The first is to use a plugin such as Scroll Depth, either out-of-the-box or in combination with your own custom HTML and other code. Some CMSes may have dedicated plugins for this, such as WP Scroll Depth for WordPress.
However, it’s more common to use Google Tag Manager. The scroll depth threshold is a built-in variable in Google Tag Manager, so the process of enabling it and connecting it to your Google Analytics account is pretty straightforward.
First, ensure that your scroll depth variables are enabled. To check this, select “Variables” in the Google Tag Manager sidebar, click “configure”, and ensure all of the options listed under “Scrolling” on the configuration page are checked off.
Second, create a new scroll tag with an appropriate name (Tags > New in the GTM container sidebar).
Third, select the tag configuration box and choose the relevant configuration option for your Google Analytics property in the overlay that appears. In most cases, this will be “Google Analytics: GA4 Event”.
Fourth, click “Select configuration tag…” and choose “None - Manually Set ID”. Then, insert your Google Analytics property’s “Measurement ID”. This can be found in your analytics property’s admin page under “Data Streams”.
Insert this tracking ID into the “Measurement ID” box in Google Tag Manager.
Fifth, in the “Event name” box enter the following text:
{{Scroll Depth Threshold}}% Scroll
Be sure that you have entered this correctly, as the page depth scroll tracking will not work properly without it.
Sixth, click anywhere in the triggering section and click the plus button to add a new trigger. Name it something like “Scroll Depth” and then select “Scroll Depth” from the “User Engagement” section of the pop-up window.
Seventh, select your preferred options in the trigger configuration menu that pops up. Unless your site is horizontal, you want to measure vertical scroll depths, enable the scroll depth trigger on “Window Load” (gtm.load), and fire on all pages.
Finally, select your scroll threshold measurement preferences. You can insert your desired percentages as a comma-separated list (i.e. 25, 50, 75, 100). Then hit save to complete your tag configuration.
Once you’re finished, you should begin to see scroll data reported in Google Analytics as a number of different Google Analytics events with names like “25% Scroll” and “50% Scroll”, depending on the options you selected in the previous steps.
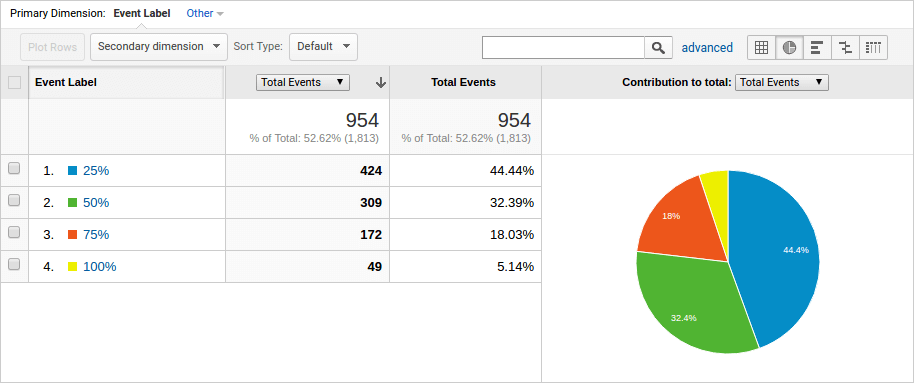 Source: SwissUpLabs
Once you’ve tested and confirmed it’s working properly, you can then take additional steps to do things such as work with the data in Google Data Studio, or adjust Google Analytics settings to bring scroll events into your favorite dashboards.
How to Track Scroll Depth in Woopra
Scroll depth is much easier to track using an event-driven analytics platform such as Woopra.
Page scroll depth is one of the page view property metrics that Woopra tracks by default, so provided you’ve already got Woopra’s tracking code installed on your site, there’s no setup required — you’re already tracking scroll depth.
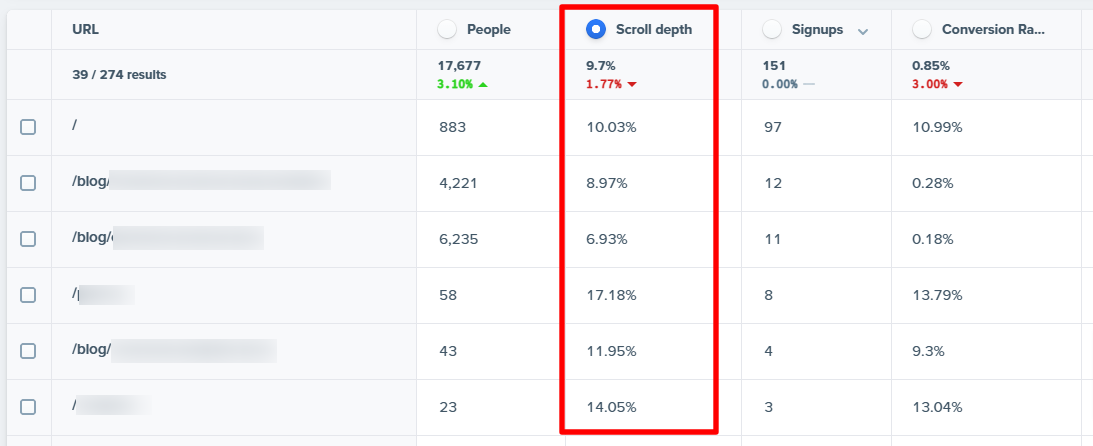
To dig into your site’s scroll depth data, simply navigate to the “Search Traffic Trends” report from your company dashboard. Scroll past the chart at the top, and below it, you will find a table with your site URLs, and a column with average scroll depth data for each URL.
What Can You Learn From Scroll Depth Tracking?
As previously mentioned, the primary thing you can learn from scroll depth tracking is how far your users are getting into your content before leaving the page.
That said, it’s important to understand that there are some major limitations to this metric. It should be considered together with other metrics as part of a broader strategy to understand your users’ behavior, rather than looked at on its own.
For example, knowing that a page has an average scroll depth of 50% doesn’t tell you much on its own. What is the bounce rate? What is the conversion rate on the CTA?
That 50% scroll depth could be a sign of bad content if the page also has a high bounce rate and a low conversion rate.
On the other hand, if the page has a low bounce rate and a high conversion rate, a 50% scroll depth might mean customers are being convinced before they even get to the end of your content — not a bad thing!
It’s also important to keep in mind that page scroll depth is an imprecise metric and it can be misleading when users don’t behave as expected.
It’s not uncommon, for example, for some users to scroll up and down a page quickly just to see what’s there. This would result in a 100% scroll depth, but it doesn’t mean that the user has consumed all or even any of your content, it just means that all four scroll depth events fired.
What to Do About Low Scroll Depth
If your scroll depth is low, the first step is to check other metrics such as bounce rate and CTA conversion rate to ensure there’s really a problem. There may not be. If your landing page is so convincing that people buy before they ever scroll down, that’s a good thing.
Assuming you determine that there is a problem — a low scroll depth in combination with a high bounce rate, for example — you can begin to make some guesses about the cause of the problem.
If it’s a piece of long-form content, for example, it may need to be updated, or rewritten with a stronger introduction to keep users from bouncing too quickly.
If you’ve investigated other metrics and taken a look at the content, but no reason for the low scroll depth has presented itself, you may need to dig deeper. Here are a few ideas:
- Use a heatmapping tool to see where users are mousing over.
- Use a session recording tool to watch user sessions on the page in real-time.
- Use surveys or direct contact to interview users about their experience on the page.
- Try making a change to the page content or implementing an A/B test, and see if the different content produces a different scroll depth result.
While scroll depth isn’t the most precise or critical of all marketing metrics, when it’s used in combination with other metrics as part of a universal analytics tracking program, it can be a useful, quick window into how your users are engaging with each page on your site.


