This is the third article in our Intro to Web Analytics series. The links to the other articles are at the bottom of the page.
In an increasingly data-driven world, understanding how customers are engaging with you on the web is more important than ever.
But there are thousands of web analytics metrics you could be tracking. Google Analytics 4 (formerly Google Universal Analytics) alone reports on hundreds of different web analytics metrics. But to truly understand your customers, you need to go beyond Google Analytics metrics or Adobe Analytics metrics.
How do you extract the signal from the noise? How can you tell which metrics are actually going to be meaningful for your business?
In this article, we’ll take a look at seven important categories of metrics to track, and specific examples of metrics within each category.
We’ll also talk about how each metric can impact your business.
Audience Data
Audience data is precisely what it sounds like: data that tells you about who’s visiting your website.
Specifically, what data you’ll have access to depends both on factors you can control, such as which analytics tool(s) you’re using, and factors you cannot control, such as a user’s browser settings and ad-blocking software.
Important audience data metrics to track include:
1. Location
 Source: Learn Digital Advertising
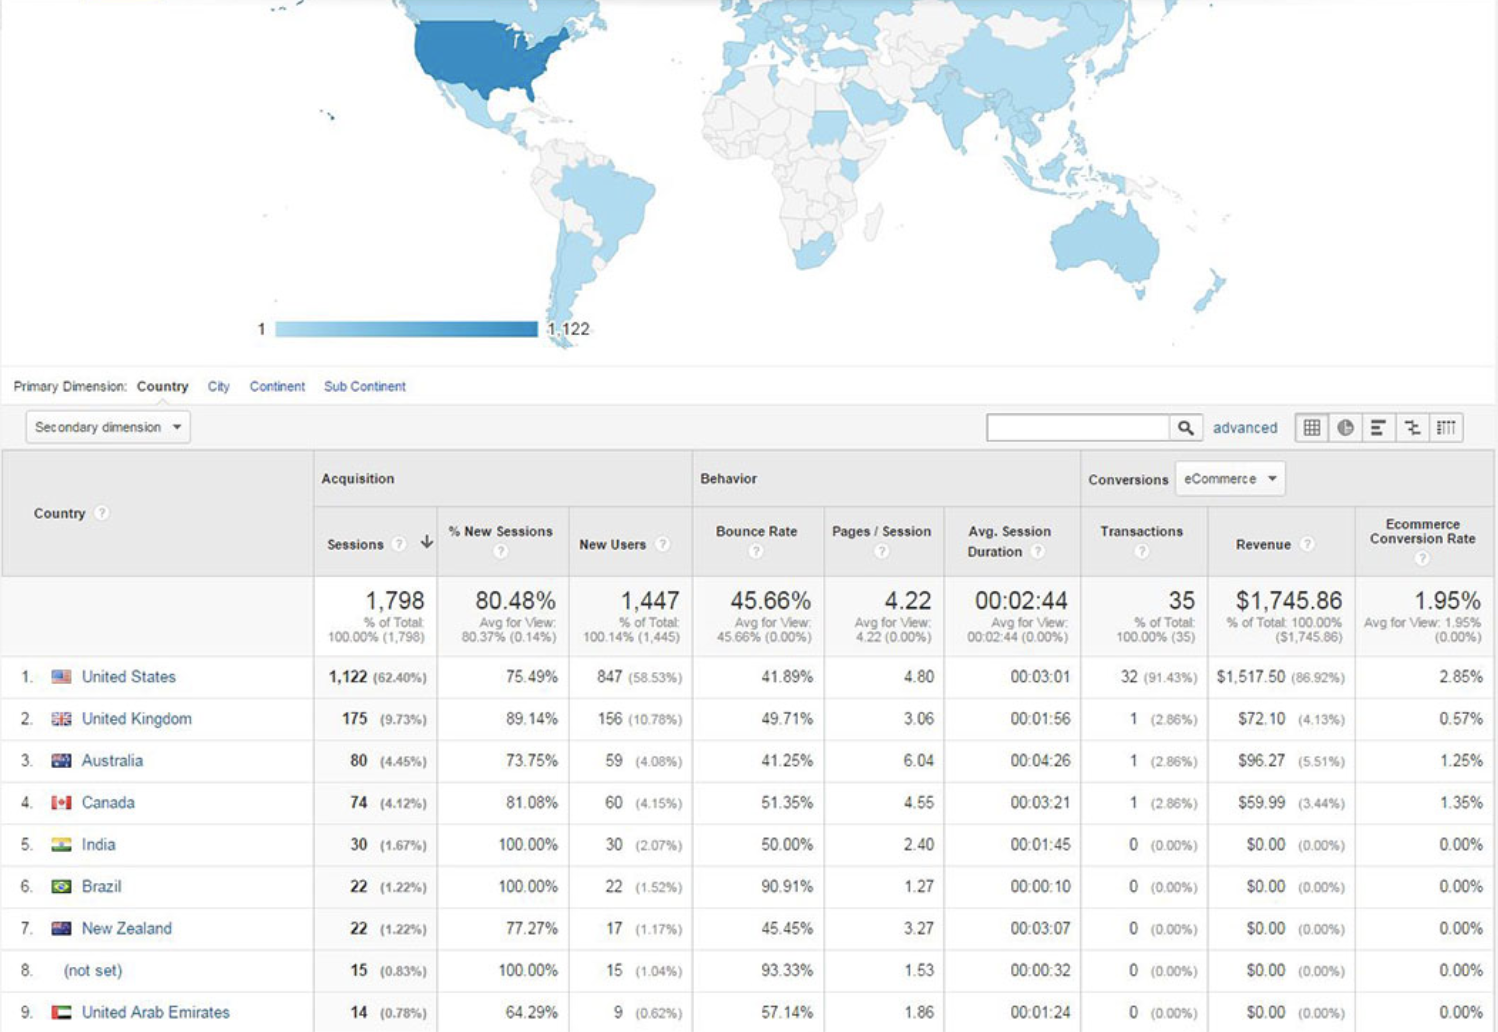
Where is your web traffic actually coming from? It’s critical to look at location as a traffic metric because it can tell you whether or not you’re engaging the markets you expect. It might also help you identify new markets to open.
For example, if you work for a company with mostly US-based customers, but see a growing trend of UK-based website visitors in your location data, that might suggest it’s worth your time to experiment with accepting payments in GBP, in addition to USD.
2. Device
 Source: Hallam Internet
How are your visitors seeing your site? At a bare minimum, if a large percentage of your web traffic is coming via mobile device, that’s something you would want to know.
But with the right website analytics tool, this metric will allow you to go deeper. For example, you might create a user segment of mobile users, and subsequently, notice that your conversion rate was lower among mobile users than desktop users.
This would suggest that you need to improve your mobile experience.
3. User Demographics
 Source: Whole Whale
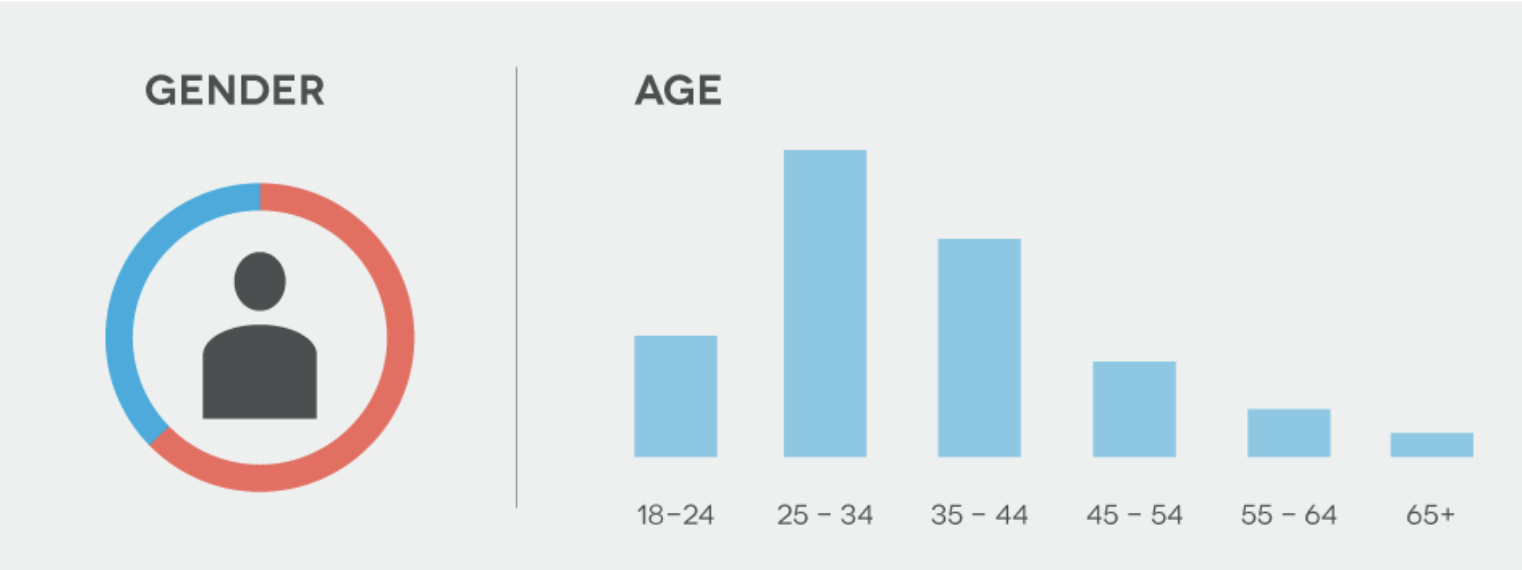
Are most of your users male or female? Are they in their teens or their sixties?
This kind of information should be available in almost any web analytics dashboard and is a key Google Analytics metric, but again, with the right tool, you can do some user segmentation to discover who your best customers are.
What customer demographics have the best conversion rates?
User Behavior Data
User behavior data is pretty self-explanatory: this category covers website data related to how users interact with your site.
(That said, we’re leaving user journey-related metrics out of this category, as we’ve given them their own category later in the article).
4. Bounce Rate
 Source: OptinMonster
The bounce rate metric refers to the percentage of visitors who leave your site after visiting one page. In other words, the percentage of visitors who hit one page on your site and immediately bounced.
When users bounce, it often indicates that they’re looking for something on a page and not finding it.
Tracking the bounce rate on your important pages is critical as a website owner because it’ll help you understand which pages are working well and which are causing users to leave your site.
From there, you can investigate further into specific exit pages to determine what site content needs to be fixed.
That said, be careful not to make assumptions about the cause of a high bounce rate before thorough investigation.
A high bounce rate can be caused by a wide variety of factors, including poor site performance, bad content, a mismatch between content and audience, etc.
5. Visit Length and Pages Per Visit
 Source: Bonfire Marketing
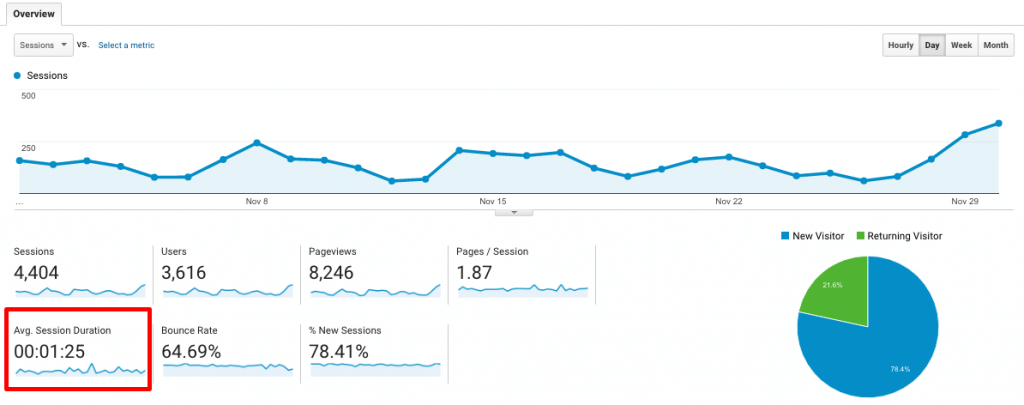
These metrics are useful for understanding session duration and how users are interacting with your site’s content. But keep in mind: longer is not always better!
In some cases -- for example, if you’ve written a long-form guide -- you may want a long session duration were users spend a lot of time on your page. But if your page is designed to convert fast, and there's a long session duration per page view where users are spending ten minutes on it, that indicates a problem.
6. Site Search
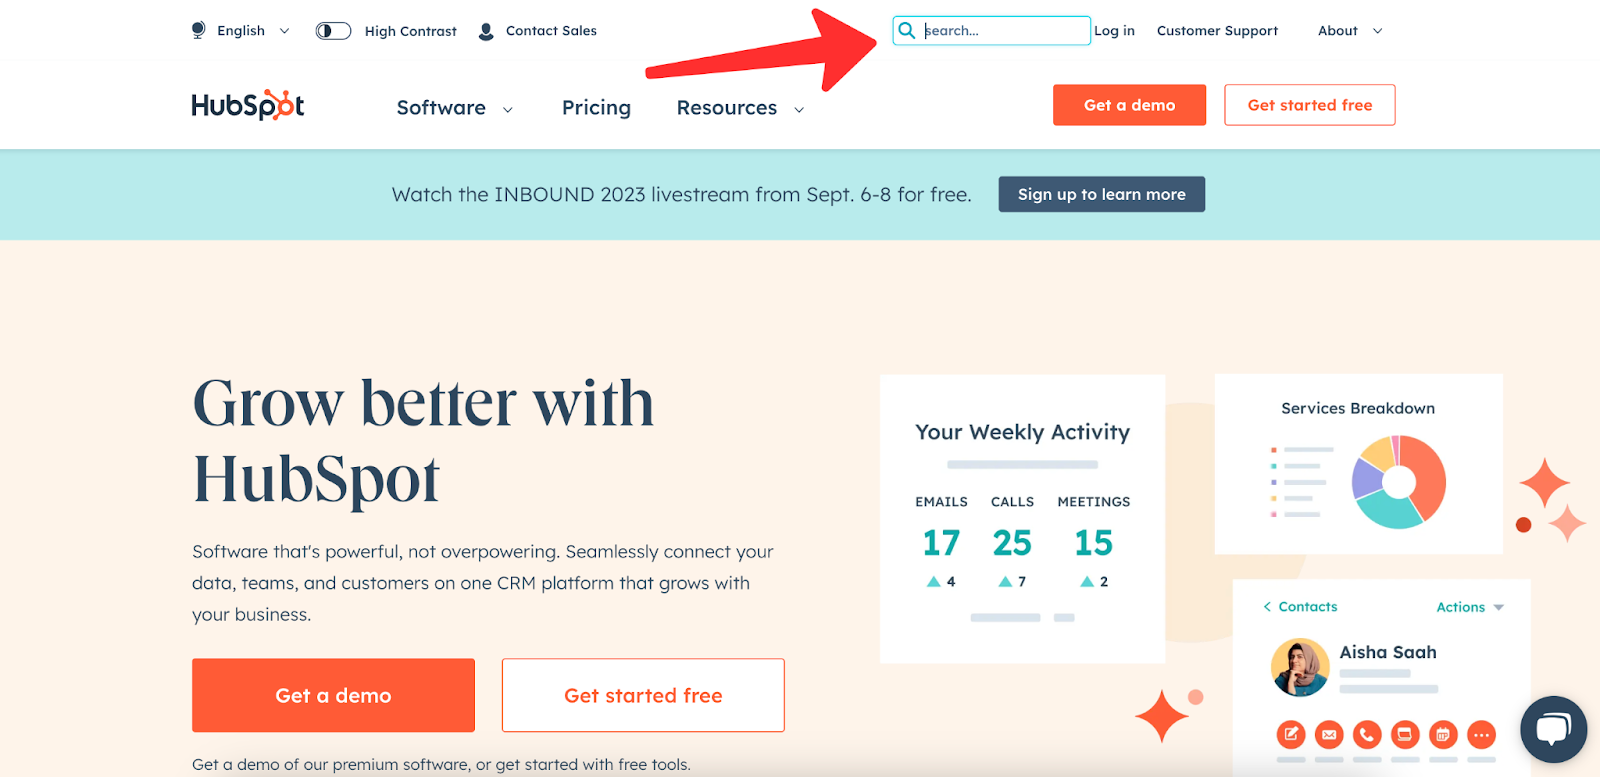
What are your customers looking for? If your site has a search bar, you should definitely be tracking the queries it receives.
 Source: HubSpot
Your users are probably telling you exactly what they want!
Optimize for Conversion & ROAS Now! Explore Woopra in a demo and enjoy a 2-week free trial: https://www.woopra.com/demo
Conversion Rate and Event Tracking
Event tracking metrics can be a little more challenging to set up because you’ve got to get your analytics tool of choice linked with whatever system is controlling conversions on your site.
This effort is more than worth it because this data will help you understand all of the other metrics better such as:
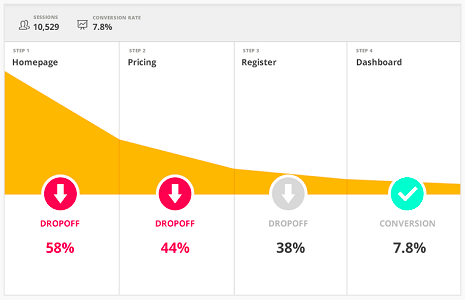
7. Conversion Rate
Source: Optimize Smart
Tracking conversions is a key metric for any business and linking them to other metrics (such as page views, ad clicks from paid search, etc.) allows you to determine a conversion rate. This, in turn, helps you identify what’s working and what isn’t.
For example, a SaaS business might have several different pages highlighting different features of the product. If visitors go to one of these pages and convert at a much higher rate than others, that suggests the digital marketing team that they should run more ads emphasizing that feature.
8. Event Tracking
Again, the specifics of this will vary based on your business, but most websites allow users to take actions beyond just conversion. A user might sign up for a newsletter, for example, or answer an online quiz.
Tracking these events allows you to uncover insights that may ultimately lead to more conversions.
For example, you might discover that users who sign up for your newsletter ultimately convert at a much higher rate than users who do not.
This could suggest you should emphasize newsletter signups (rather than conversion) as a CTA across your website, even if conversions are ultimately your most important KPI or key performance indicator.
Individual Customer Journey Tracking
Customer journey analytics metrics relate to the way that users interact with your site over time, as well as how they get there. (This is a type of user behavior data, but it’s important enough that we’ve given it its own section).
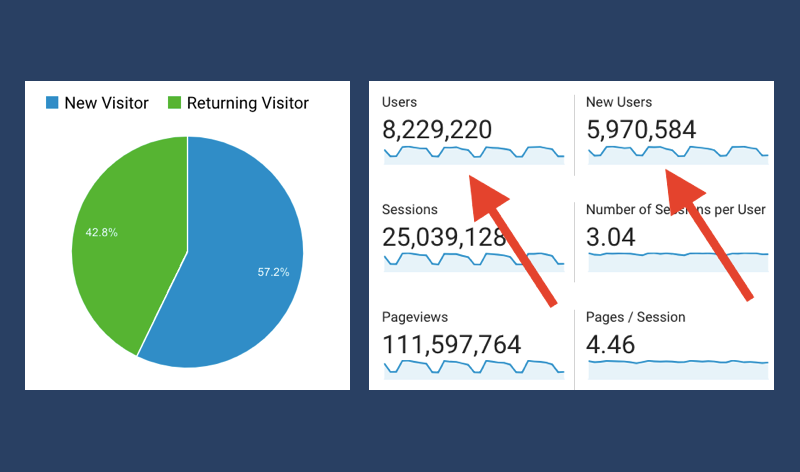
New or Returning Visitor
 Source: Digital.gov
Understanding when and how often people visit your site is a critical step in understanding the customer journey. Bringing in unique visitors is good, but if you have very few returning visitors, that might suggest a problem. (Your customer journey metrics may give you good insights here.)
When tracking this metric, it’s important to be aware of the limitations of the analytics tool you’re using. Google Analytics, for example, uses session-based tracking, so you won’t be able to follow a user’s journey over months or years to see how they interact with your product.
Just how accurate is Google Analytics? Broadly, that’s an open question, but when it comes to this specific metric, the answer is: not very. A user who’s visited your site once a year for the past ten years will show up as a “new” wensite visitor every time in Google Analytics.
An analytics platform like Woopra, which offers user-based tracking, is better for digging deeper into the customer journey because it allows you to identify and track individual users over much longer periods of time.
This is why it’s important to compare web analytics tools, and also to understand what different kinds of marketing tools do. If you’re comparing Hubspot vs Google Analytics, for example, you may want to cast a wider net!
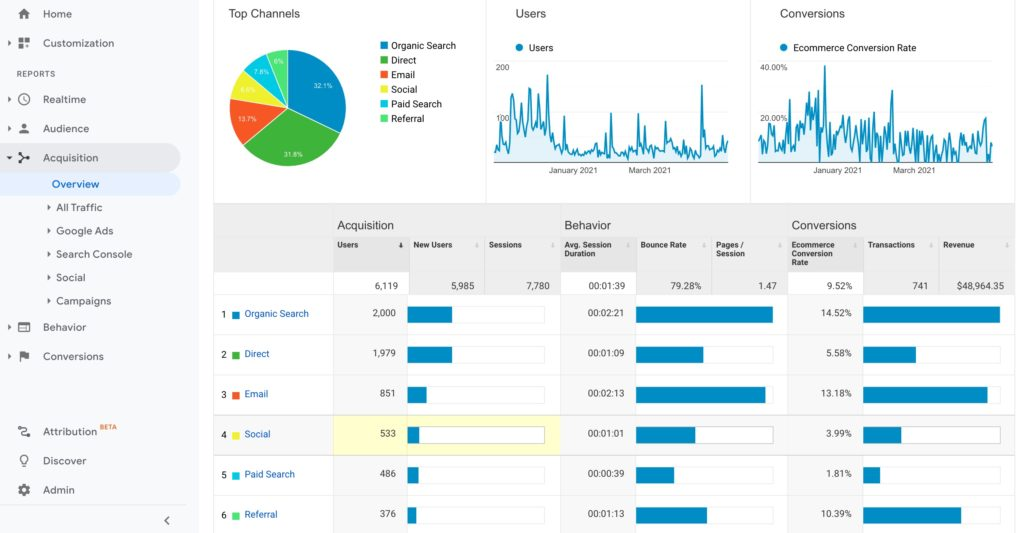
10. Traffic Source
 Source: Blue Hills Digital
Where are your users coming from? How much organic traffic (website traffic from search engines) are you getting? How much direct traffic? Is there a particular Google Ad that’s creating a high volume of traffic? Is your social media engagement actually leading to more page views?
These are all questions that analyzing your traffic by source can help answer.
When combined with conversion data, looking at the traffic source can also offer valuable insights about meaningful audiences that you can target.
For example, if a large amount of social media referral traffic from Reddit is coming to your site and converting at a well-above-average rate, that might suggest you should develop your digital marketing efforts to focus on that social media community.
Or, if the majority of your traffic comes from Google Search and it’s leading to consistently high conversion rates, you may want to double down on your SEO and content marketing.
Using the Google Search Console in conjunction with other web analytics tools can provide you with a detailed overview of traffic source trends, making it a critical metric to use in your campaign.
11. Landing Pages
The landing page is whatever page a user starts on. Track this metric in combination with other ones, such as the user’s search terms, to ensure that users are finding whatever they were looking for on the landing page their search led them to.
If you see high bounce rates on a landing page, that typically means that users are not finding what they were looking for, or there’s something broken or unappealing about the page. For more information, see the section on bounce rate above.
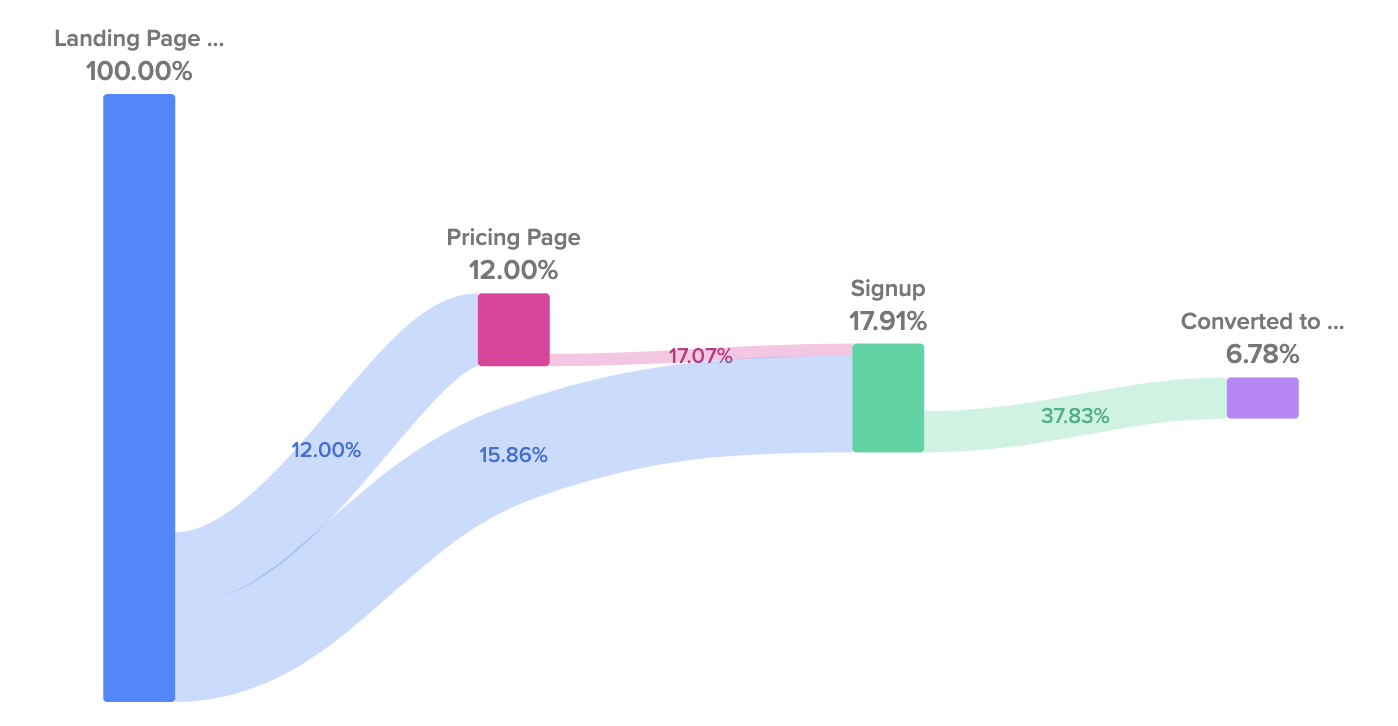
12. Page Flow
 Source: Woopra Analytics Dashboard
How are users engaging with your site? What pages do they start on, and where do they go from there? What are the exit pages?
Understanding how users move through your site is critical to understanding their user journey, and it’s often useful for product analytics, too.
To get the most out of this metric, it’s useful to have website analytics tools that offer an intuitive, visual illustration of a user’s movement through the site.
From the moment a unique visitor touches down to the exit pages they leave through, this lets you know exactly what the page flow is like.
13. Website Performance
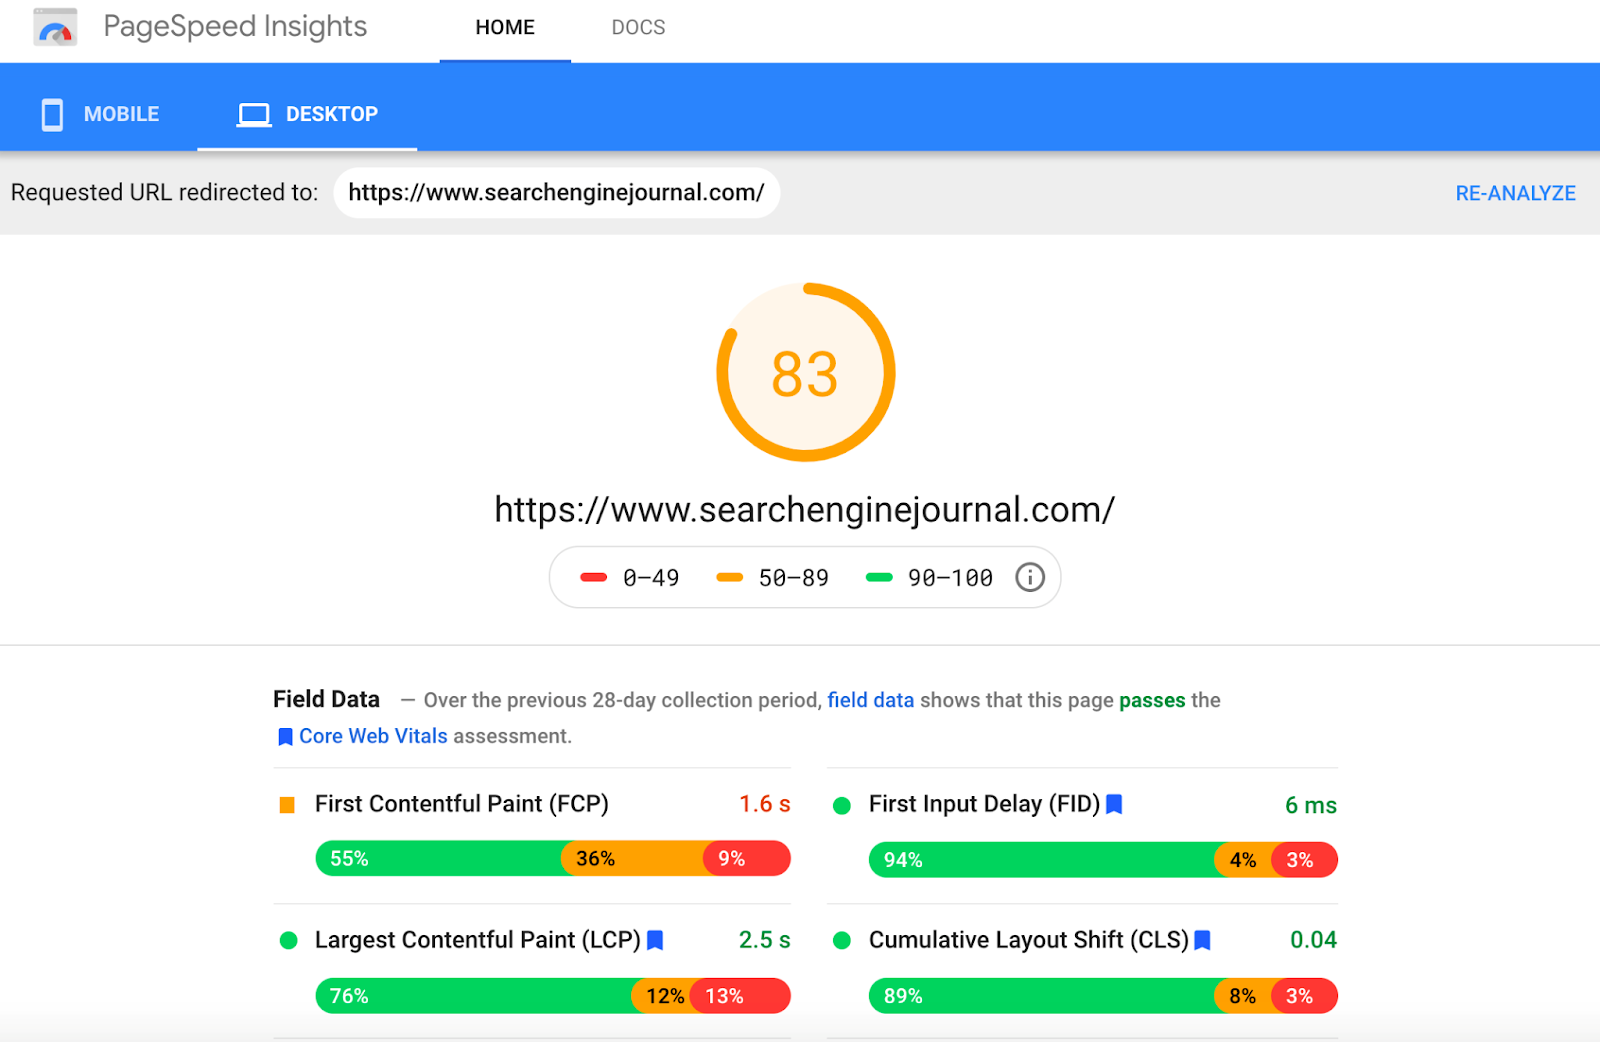 Source: Search Engine Journal
Part of understanding a user’s journey means understanding how they’re experiencing your website. For example, when a new site visitor comes to your homepage, how fast does it load?
Any website metric could fall under performance, but the most important from a web analytics perspective are metrics like page speed (through a tool like PageSpeed Insights) and Google’s Core Web Vitals metrics (LCP, FID, and CLS).
For example, one cause of a high bounce rate is poor performance. If a page doesn’t load quickly, many users will leave, inflating the bounce rate. If you’re not tracking performance as one of your web metrics, you might not identify the true cause of the high bounce rate.
Funnel Analysis
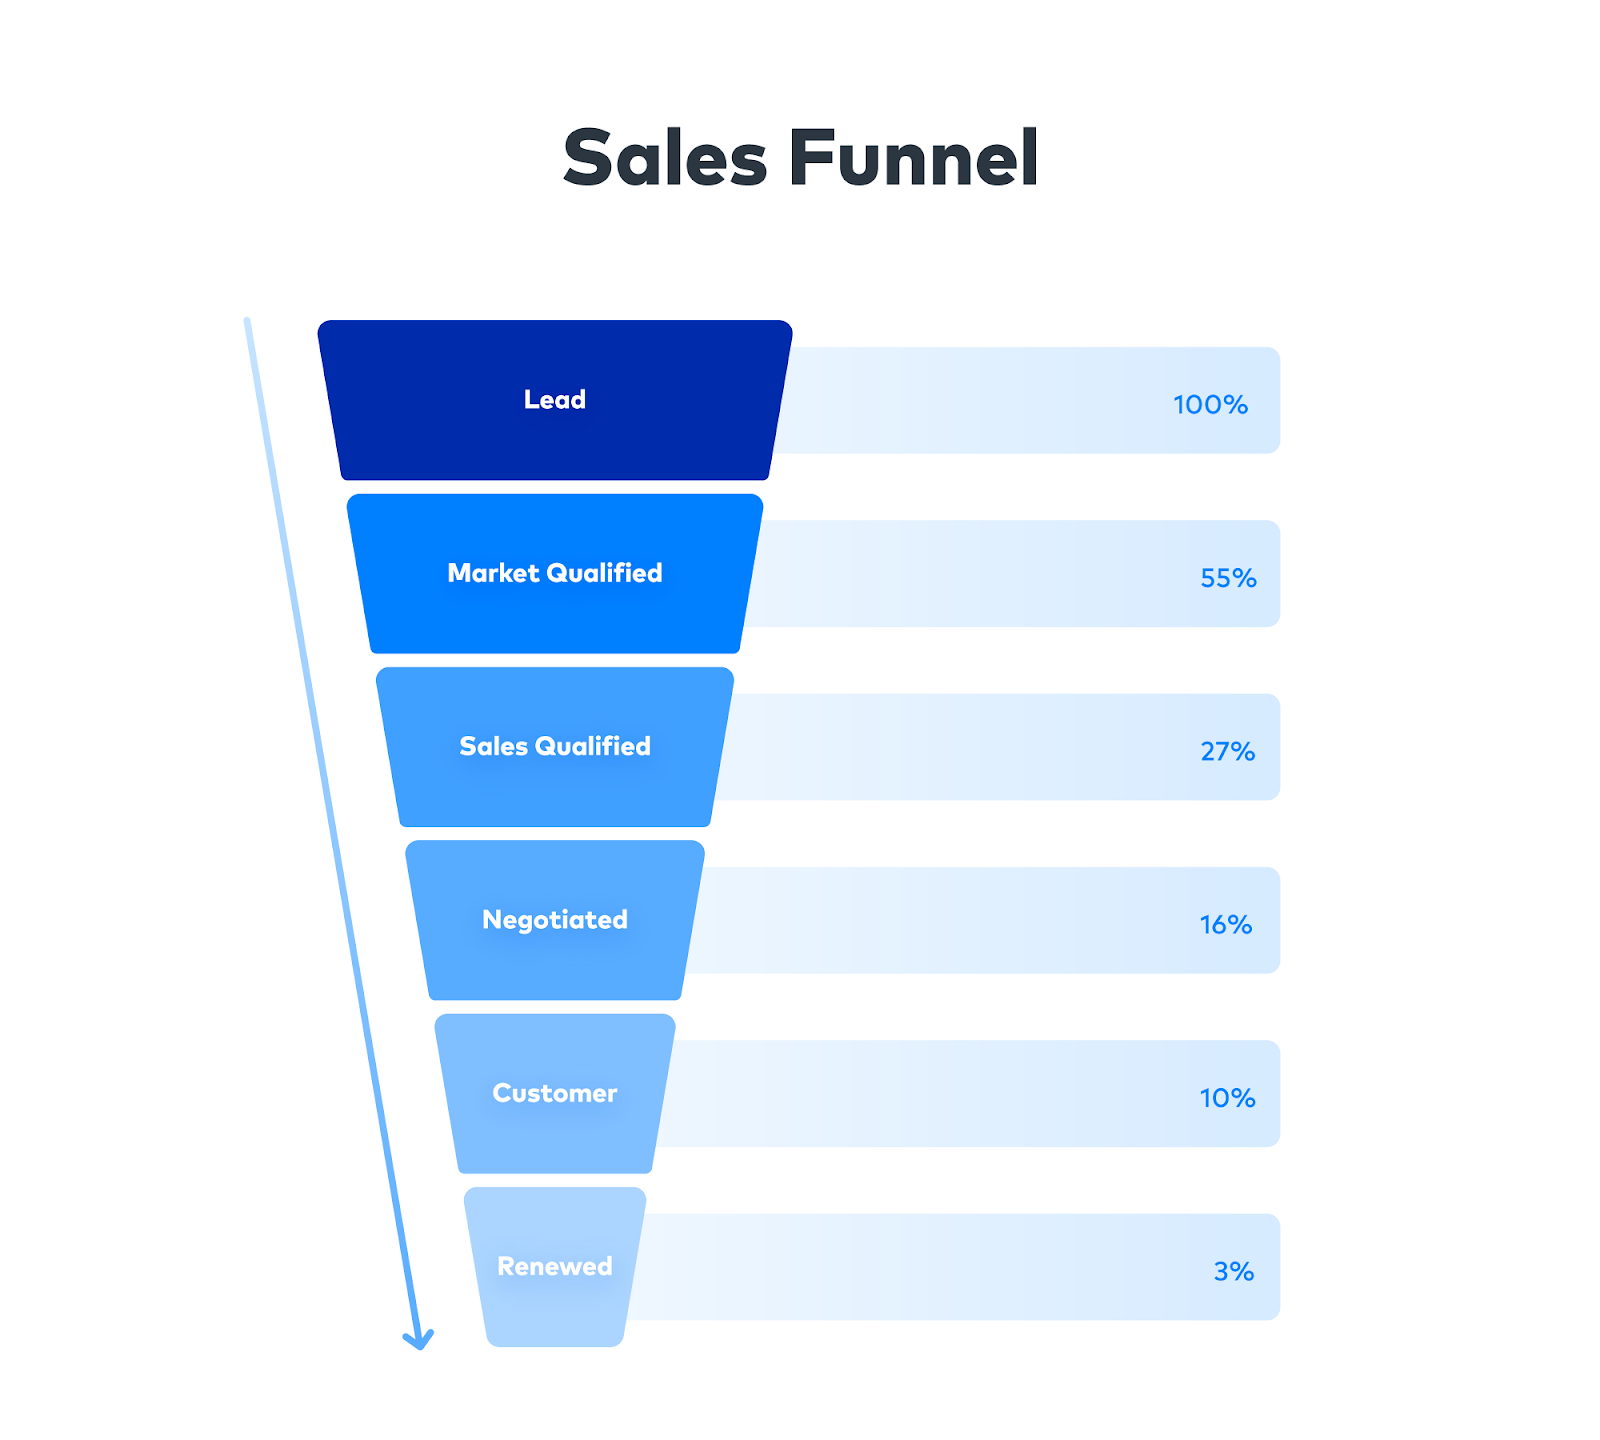
Understanding the marketing funnel, and where users might be falling out of it, is critical for effective, efficient marketing. Funnel analysis metrics allow you to track this directly.
Note that not all analytics tools are equal when it comes to funnel analysis. Choosing a tool such as Woopra that provides intuitive, visual reports can make this analysis easier.
14. Volume (By Funnel Stage)
 Source: Fivetran
Volume refers to the sheer number of users present in each stage of the funnel, and it’s useful for measuring whether your marketing campaigns are bringing in enough people.
If, for example, your conversions are low this month, it might be because conversion rates dropped, but it might also be because fewer people came through your marketing funnel. It’s important to be able to tell which of these problems you actually have!
15. Velocity (By Funnel Stage)
Velocity refers to how quickly users move through a funnel stage.
Success will be defined differently here for different companies. Some companies may want users moving through their full funnel and converting within a day or two; others may have more complex products that engage users for weeks or months before conversion.
Whatever the specifics, though, it’s important to track how quickly people are moving through your funnel so that you can spot potential problems quickly if the pattern deviates from the norm.
16. Conversion Rate (By Funnel Stage)
We’ve already talked about conversion rates, but combining your conversion data with funnel metrics is a key method of understanding the effectiveness of your marketing activities.
Marketing Campaign KPIs
Most companies are engaged in a wide variety of marketing activities. But how do you know which ones are actually working? By tracking marketing campaign metrics!
17. UTMs
To facilitate tracking, most marketing campaigns will drive traffic to a website using tracking links that allow you to identify which campaign the user is coming from. It’s critical that your analytics platform is set up to track these correctly.
18. Email Metrics
 Source: SendPulse
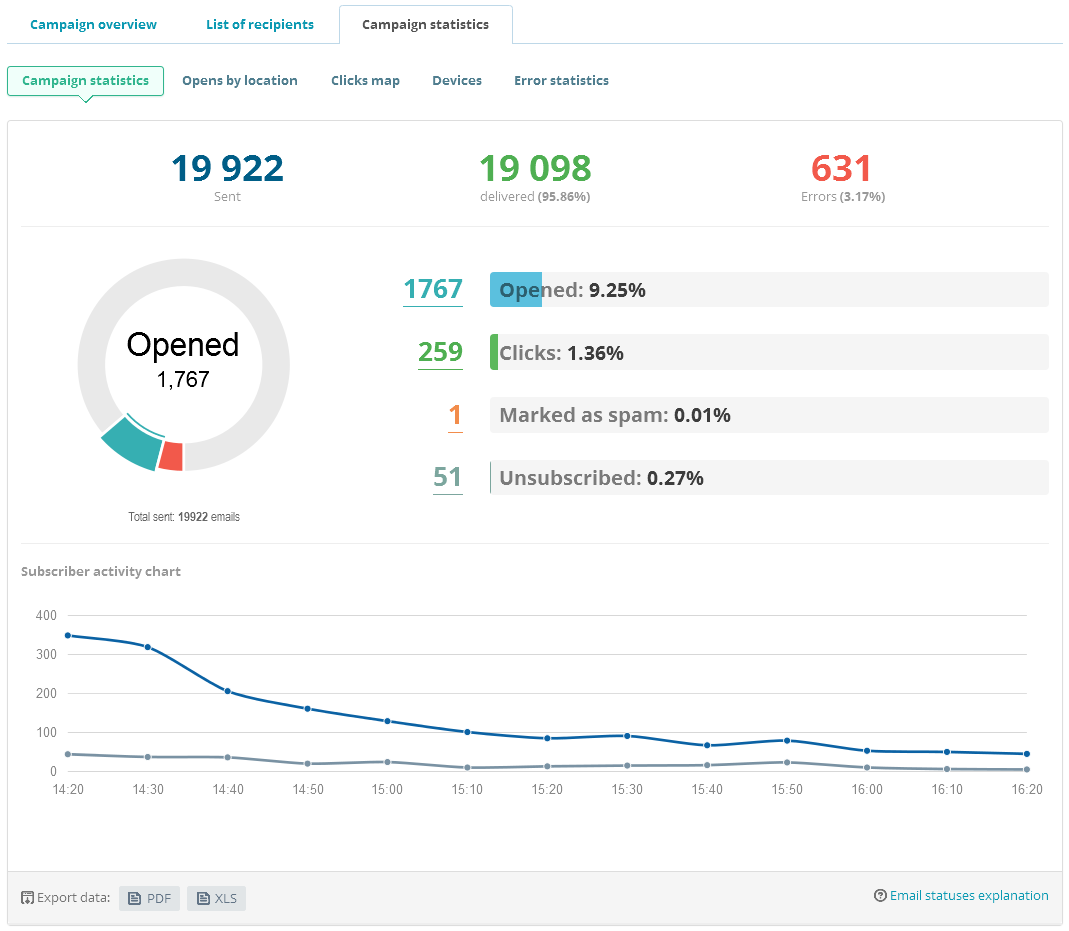
While UTMs can tell you about the email readers who subsequently visit your site, a variety of other email metrics can be useful for understanding whether you’re hitting your marketing KPIs or not.
Different email providers offer different solutions and metrics here.
But some of the most important ones to look at include open rate (if this is low, it may indicate a boring subject line), click rate *(which measures the rate at which users engaged with the email), and *unsubscribe rate.
19. Campaign Audiences
We discussed audience tracking metrics above, but campaign-specific marketing audiences also deserve a special mention here. If you’re targeting a specific user segment, you want to be able to understand if it’s working.
This is another reason it’s very useful to have a fully-featured analytics tool such as Woopra that offers user-based tracking and customizable user segmentation. You can use these features to identify the audience of a particular marketing campaign and then analyze how they behave.
Automation
Tracking all of these metrics manually would be difficult for a single person to do regularly. It’s certainly not feasible to expect everyone at your company to do it!
Thankfully, metrics-linked automation can help you respond to the data without having to look it up proactively. Here are a few metrics that it’s worth tying automation to, and some ideas of how to go about doing that.
20. Email Signup > Nurture Emails
When a user gives you their email address, you should use it! Creating an automated nurture sequence that begins to send as soon as an email signup event is triggered in your analytics tracking can help you engage more new users immediately.
21. Lead Enters Funnel > CRM Notification
For sales-driven businesses, linking funnel analytics to the CRM is critical.
You don’t want your salespeople to have to go digging through the data. When a user qualifies as a lead, that should trigger an automatic notification and add a record to the CRM about them.
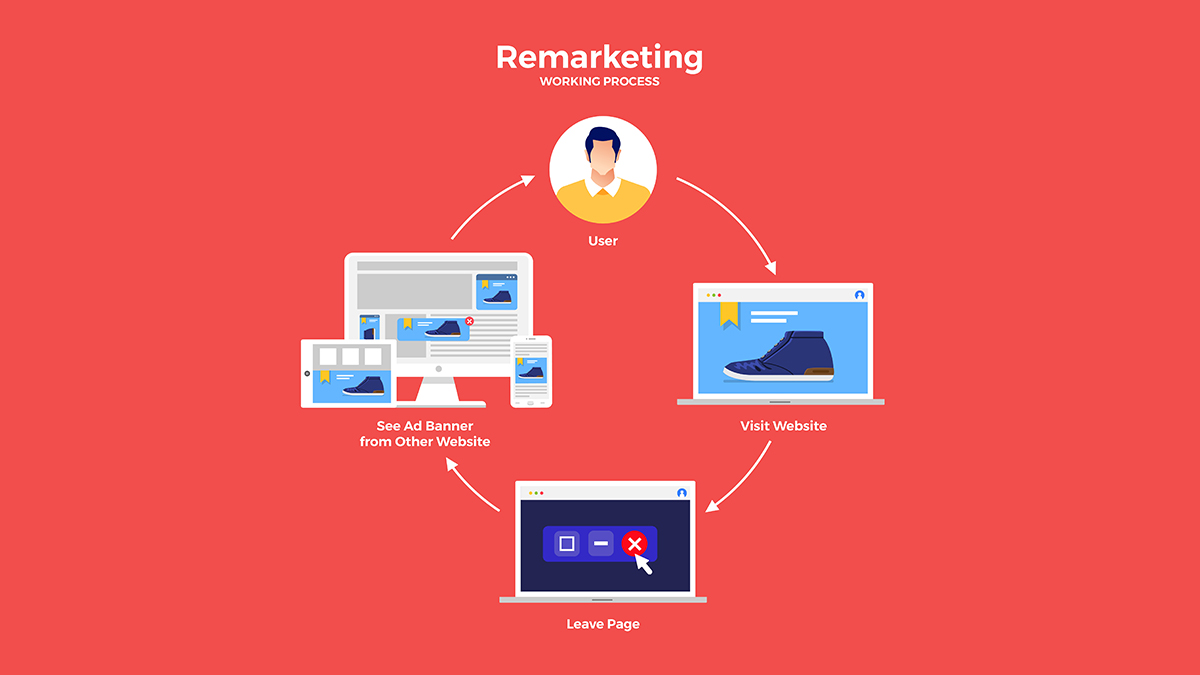
22. Repeat Visitor > Remarketing Campaign
If a visitor is coming back to your site frequently, you can link that engagement metric with your advertising platform or platforms to automate remarketing campaigns designed specifically for repeat visitors.
 Source: AIMG
23. Pageviews Drop > Automated Email to the Team
Particularly at smaller companies without a dedicated data team, it can be helpful to have automated notifications set up when significant changes occur in key metrics.
That way, if a problem pops up, you’ll catch it as early as possible!
And even if there isn’t a problem, getting regular notifications about changes to your web analytics data helps you keep a finger on the pulse of your company’s website traffic, website user engagement metrics, and overall user experience.
Read the other articles in our Intro to Web Analytics series:
- What is Web Analytics? How It Works in 2024
- Types of Web Analytics: On-Site, Off-Site, Tools, and More (2024)
- The Best Web Analytics Tools (2024)
- How Much Does Web Analytics Cost in 2024?


