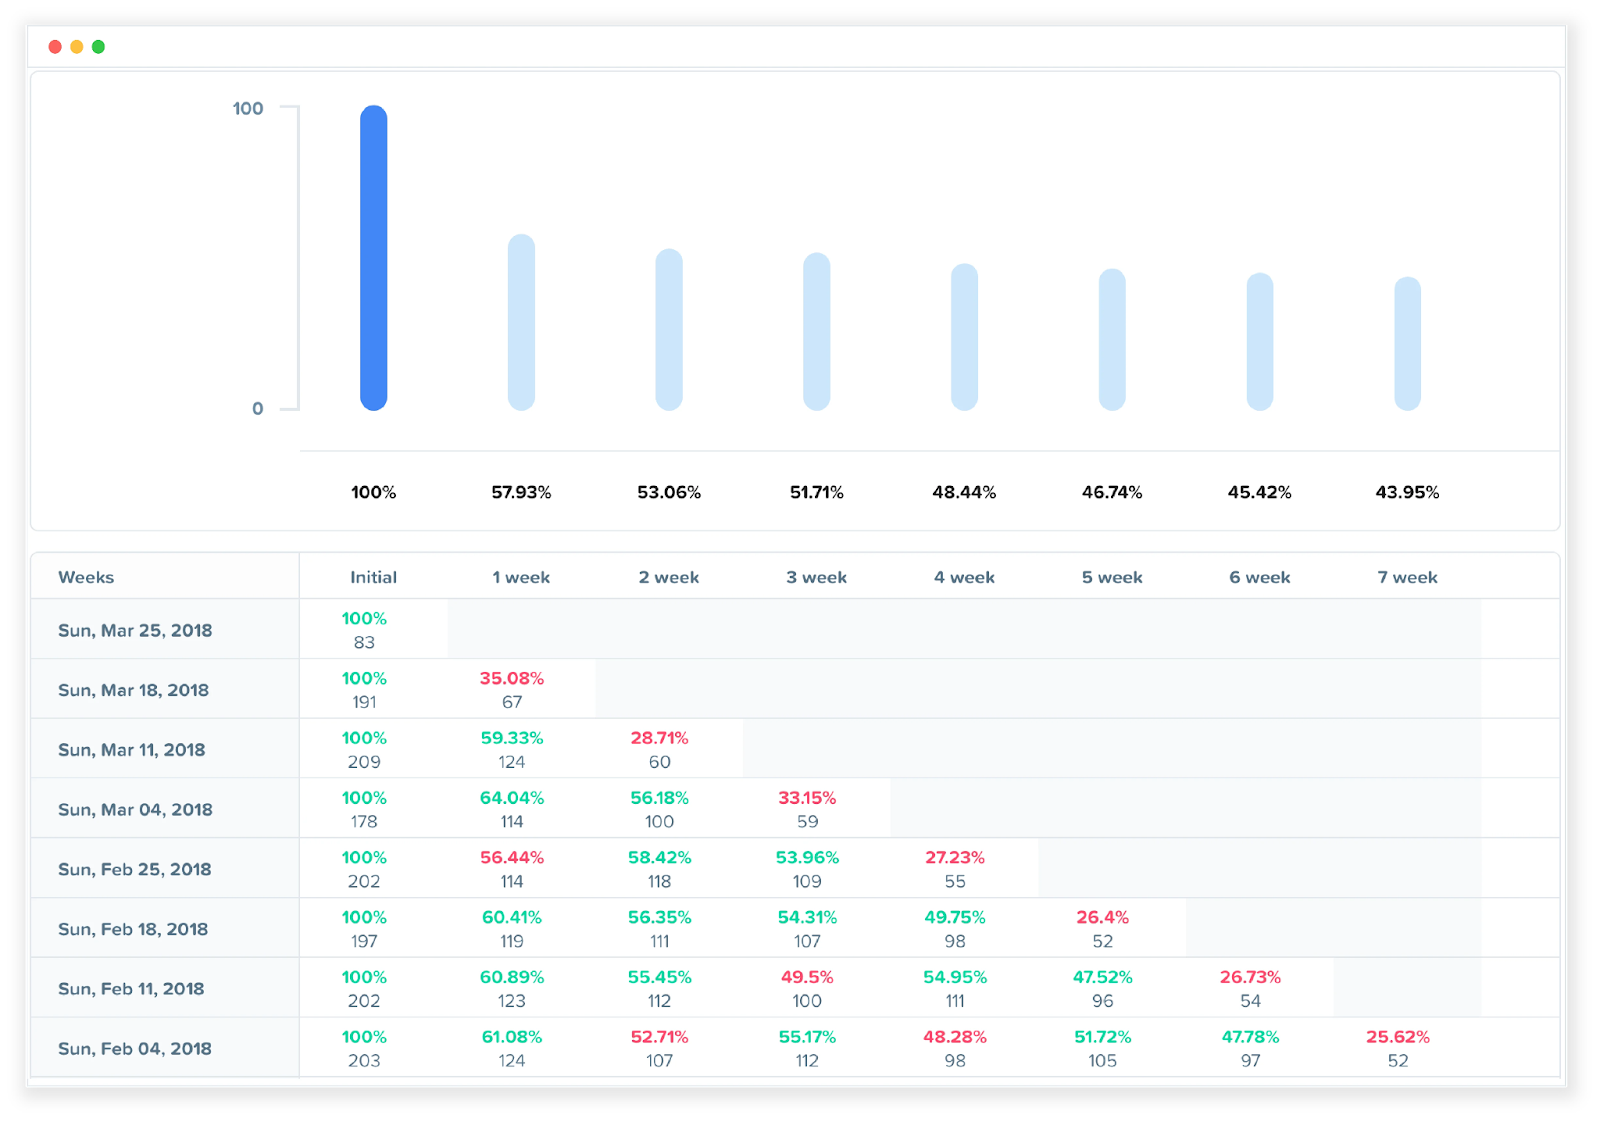
Product performance analytics should be a top priority for any online business in 2024.
Keeping up with the competition now requires a data-driven approach, and product performance analytics is one of the most impactful ways you can capitalize on your business’s data to glean insights into the customer journey.
What is Product Performance Analytics?
Product performance analytics is exactly what it sounds like: it’s the practice of using data to analyze a product’s performance and making more informed devisions based on user behavior.
Product performance analysis through a tool like Google Analytics or Woopra will look at every aspect of the customer journey with respect to a specific product, including examining data related to the product’s marketing funnel, activation statistics, product usage, and long-term customer retention.

Typically, product performance analysis will look at every aspect of the customer journey with respect to a specific product, including examining data related to the product’s marketing funnel, activation statistics, and long-term customer retention.
This will include funnel analysis, marketing analytics data, sales data (including sales trend analysis and historical data), and all available product metrics relating to your long-term customer retention rate stored in your data warehouse.
The goal of product data analytics is to find actionable insights that can improve product sales metrics and impact other important KPIs, such as increasing user engagement and feature adoption, optimizing the user experience, boosting customer satisfaction, and reducing churn.
These analyses are most effective when they’re folded into the product development process, and a product performance report is created and re-created repeatedly over the lifecycle of each product.
Fostering a data-driven product team can be challenging in the short term, but it will pay long-term rewards.
Why is Product Performance Analytics Important?
Product performance analytics is important because without digging into every available aspect of your product’s data, you may miss opportunities to make improvements or misdiagnose problems (and thus fail to solve them).
Product managers, for example, are often intimately involved in the new product development process, pushing for product innovation, working out an efficient supply chain, and overseeing quality control.
But once a specific product has been released, its success or failure is often judged based entirely on sales performance.
But why do some products sell better than others? Looking at the overall performance of a digital product or a physical one often doesn’t tell us anything that we don’t already know: this product isn’t performing well.
To get meaningful insights, we need to go deeper with a product analytics tool that offers robust quantitative data.
The reason a product succeeds or fails may have nothing to do with product attributes, and everything to do with other factors such as marketing decisions, broader market trends, merchandising approaches, product feature implementations, issues with the brand, etc.
A product analytics tool tool is important because it allows you to dig deeper than the sales trends and find the real things that are holding your product back from becoming the dominant player in its product category.
With it, you can do funnel analysis, retention analysis, and everything in between for actionable insight into all aspects of customer behavior along the way.
New product development is another reason product performance analysis is important. The lessons you learn from analyzing existing products can be applied to new products.
Product Performance Metrics:
In an ideal world, a dedicated product analytics manager should be a part of your product team.
However, smaller companies, startups, and larger enterprises that are still growing their product team can absolutely conduct a product performance analysis on their own and gain valuable insight.
Ultimately, product analytics should become the domain of the product.
But it often makes sense to start with marketers conducting the analysis, since many important product metrics will be familiar to the marketing team.
Reading a few product analytics books is a good start, but to make things even simpler, here are a few specific metrics that almost any company will want to look into for every product they offer.
(Note that these metrics are starting points. Simply looking up these numbers may produce real insights, but the real gold is found by digging as deep into the data as possible to uncover the factors that influence these critical business metrics.)
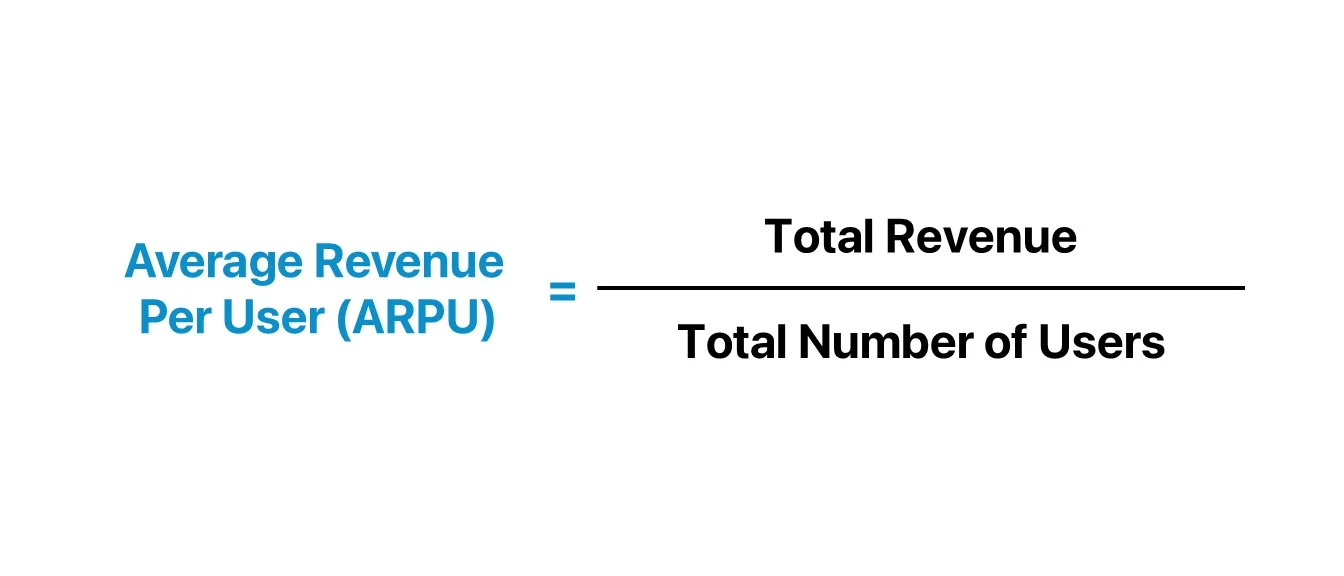
Revenue Per Customer
Looking at how much revenue you’re earning per customer with product analytics is a great way to get information about your product category and how closely it matches the audience your business is attracting.
 Image Source: Wall Street Prep
If you’re analyzing poor sales of a $500 fashion product, for example, but your average revenue per customer is less than $100, you’ve likely found the root of the problem: the audience that’s being attracted by your marketing is not interested in making purchases in that price range.
Looking at a product’s performance with knowledge of the broader trends in revenue per customer can be really helpful for understanding where a specific product fits into your product line and suggesting promising avenues for better product management and new product development.
Optimize for Conversion & ROAS Now! Explore Woopra in a demo and enjoy a 2-week free trial: https://www.woopra.com/demo
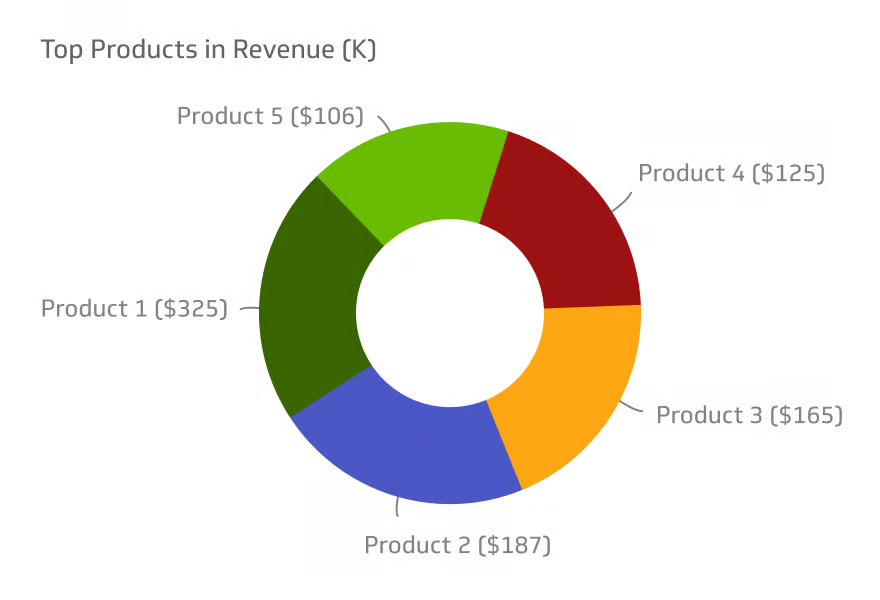
Revenue Per Product
Revenue per product is another baseline product performance metric that will answer a very simple but important question: Which products are bringing in the most money?
This could point you in a different direction than the raw sales numbers, so it’s always worth looking at with a data analytics tool.
 Image Source: Wall Street Prep
Is it best to focus on selling a few more of your most expensive, highest-margin products, or double down on maximizing the sales volume of lower-margin products?
You won’t know until you’ve had a chance to dig into the data using product analytics tools.
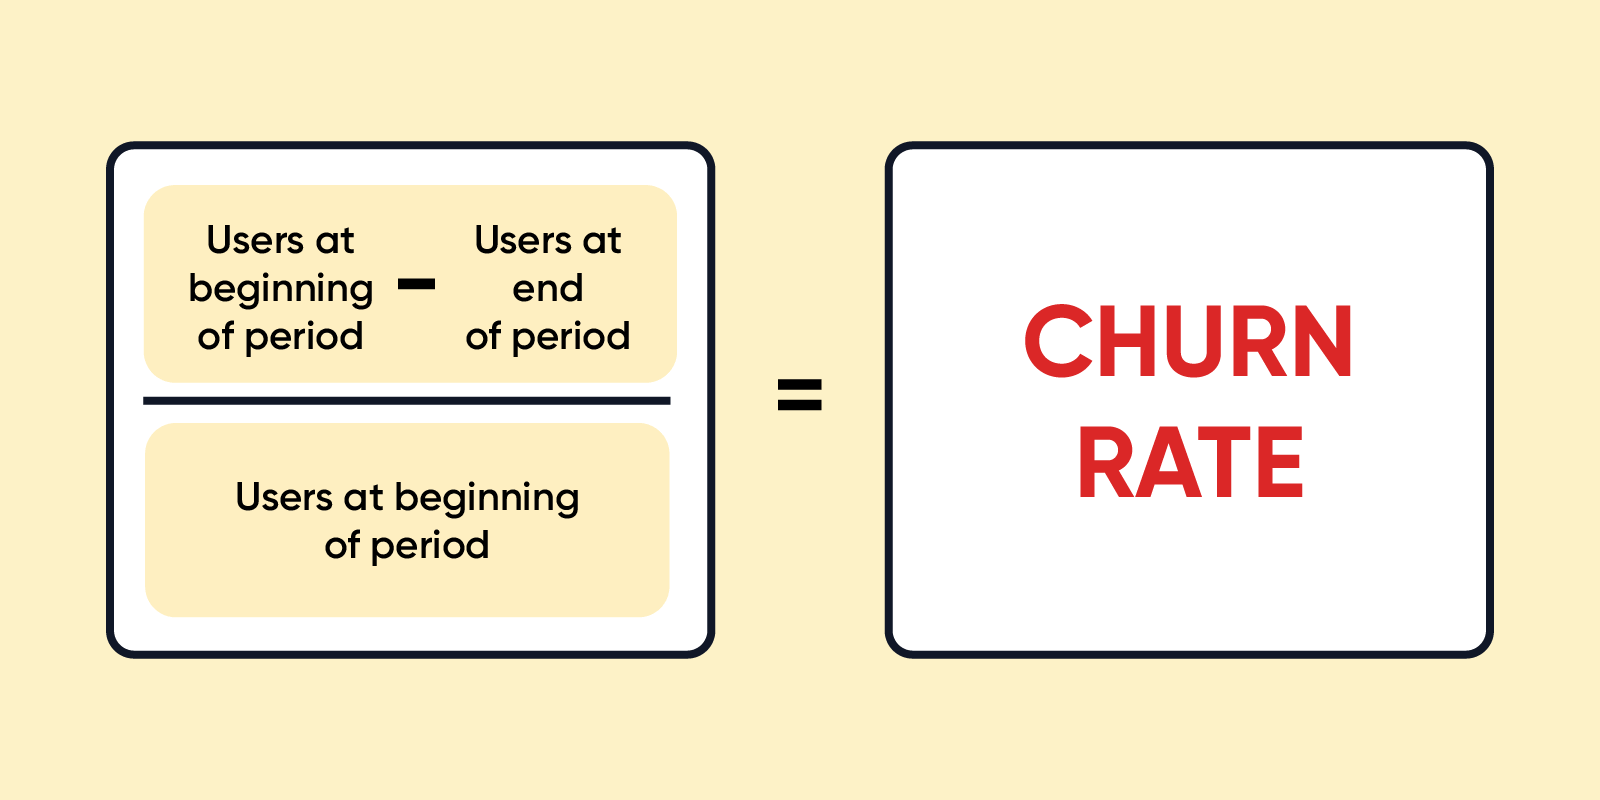
Churn Rate
Churn rate refers to the rate at which customers leave a subscription-based service, and it’s an absolutely critical metric for any business with a SaaS or other subscription-based model.
It’s possible, for example, to have a product that looks perfect: it’s got a great conversion rate, it’s hitting its sales goals, and you’re getting tons of new monthly subscribers.
If those users churn (unsubscribe) after a month, however, the product’s high sales won’t translate into high revenues.
 Image Source: Clever Tap
Even with a highly successful product, you may be able to find ways of optimizing the product’s performance that will allow you to reduce the churn rate, thus increasing the revenue you can earn from each customer.
Looking at the behavior of active users is often a helpful metric for churn analysis. When do customers stop using your product? If you can improve the product experience, decrease friction, or make other improvements that keep your users happy.
For products with a longer product life cycle, it’s often beneficial to look for early indicators in user behavior that can be linked to churn in the long term, so that you can measure the impact of changes without having to wait months for new ecommerce analytics data to come in.
It can also be helpful to look at early customer satisfaction metrics like a Net Promoter Score (NPS). Just be aware that these don’t necessarily correlate with churn!
A user who submits an enthusiastic 10 NPS score in their first week isn’t necessarily immune to churning — you’ll have to dig into your company’s data to see how NPS scores correlate with churn for your specific product and audience.
Customer Lifetime Value (LTV)
Related to churn is another metric called LTV. Increasing the lifetime value of your customers is a surefire way to increase revenue without increasing your marketing spend.
The trick, of course, is figuring out how to increase LTV, and that’s where a product performance analysis tool comes in.
With a SaaS model, analyzing product metrics, such as user activity and user engagement, can help you increase customer satisfaction, reducing churn and thus raising a customer’s LTV.
With an eCommerce platform model, analyzing user behavior, purchase trends, product page bounce rates, and other web metrics can help you make better recommendations and turn more one-time purchasers into repeat customers.
It’s a simple way to achieve enhanced ecommerce and reduce friction points in the user journey.
Conversion Rate and Abandonment Rate
Conversion rate and abandonment rate are two sides of the same coin. Your conversion rate is the percentage of people who view a product and buy it.

The abandonment rate is the percentage of people who view a product but don’t buy it. Both of which can be accurately measured with product analytics software.
If a product is converting well, it’s likely related to a number of factors, including an effective marketing funnel that’s bringing the right audience to your site and solid user engagement among trial users.
There’s also likely to be an effective user experience on the page that’s getting users to the product they want and an effective sales page that’s making users feel comfortable about making a purchase.
Conversely, if a product has a high abandonment rate, that may not reflect anything about the product quality.
Anything from poor audience targeting at the top of the marketing funnel (not targeting the correct demographic in a Google Ad, for example) to poor-quality pictures on the sales page could be negatively impacting the conversion rate of a good product.
That’s why digging deep into the data with product analytics and thoroughly analyzing each user interaction is so critical.
Getting the Best Out of Product Performance Analytics
The most effective product analytics strategy will take advantage of data collected throughout the entire customer journey. From funnel analysis to user activation to user action to feature adoption to customer retention, a comprehensive approach is key.
You must conduct a thorough investigation of how customers interact with a product from the first marketing touchpoint to the last moment they’re using the product.
The most effective product teams will fold this analysis into their regular processes, continually assessing the performance of existing products to improve their performance and to provide insights that can assist in the development of new products.
Additionally, this can positively influence future marketing campaigns and provide an overall better user experience.


